Per Welfare...
(NPD) October 2023: #1 Spider-Man 2 #2 Super Mario Wonder #3 AC Mirage; PS5 #1 Units + Revenue, NSW #2 Units, XBS #2 Revenue
State of the market
U.S. consumer spending on video game content, hardware and accessories fell 5% vs YA, to $4.0B. Declines were experienced across all categories of spend. The dip was partially driven by Call of Duty shifting release months.
Spending on video game content in October fell 4% when compared to a year ago, to $3.6 billion. Growth in physical console software and mobile spending was offset by declines in other areas, particularly digital premium downloads driven by the release date shift of Call of Duty.
Hardware
Video game hardware spending fell 23% when compared to a year ago, to $327 million. All current generation consoles experienced a double-digit percentage decline in dollar sales when compared to a year ago.
PlayStation 5 was the best-selling hardware platform in both unit and dollar sales during October 2023. Xbox Series ranked 2nd in dollar sales, while Switch was #2 in units. Year-to-date hardware spending was 6% higher when compared to the same period in 2022, at $4.0 billion.
Software
Marvel’s Spider-Man 2 was the best-selling game of October, instantly becoming the 4th best-selling game of 2023 year-to-date. Marvel’s Spider-Man 2 also led all titles in physical software dollar sales during October. Launch month dollar sales of Marvel’s Spider-Man 2 exceeded those of September 2018’s Marvel’s Spider-Man by a double-digit percentage.
Super Mario Bros. Wonder debuted as the #2 best-selling game of October 2023. It currently ranks as the 21st best-selling game of 2023 year-to-date (note: digital sales for Nintendo published titles are not inluded in the title sales ranking charts).
Roblox was released on PlayStation platforms during October and ranked 4th across all titles on PlayStation 5 in U.S. monthly active users, according to Circana’s Player Engagement Tracker, trailing only Call of Duty: Modern Warfare II, Fortnite and Marvel’s Spider-Man 2.
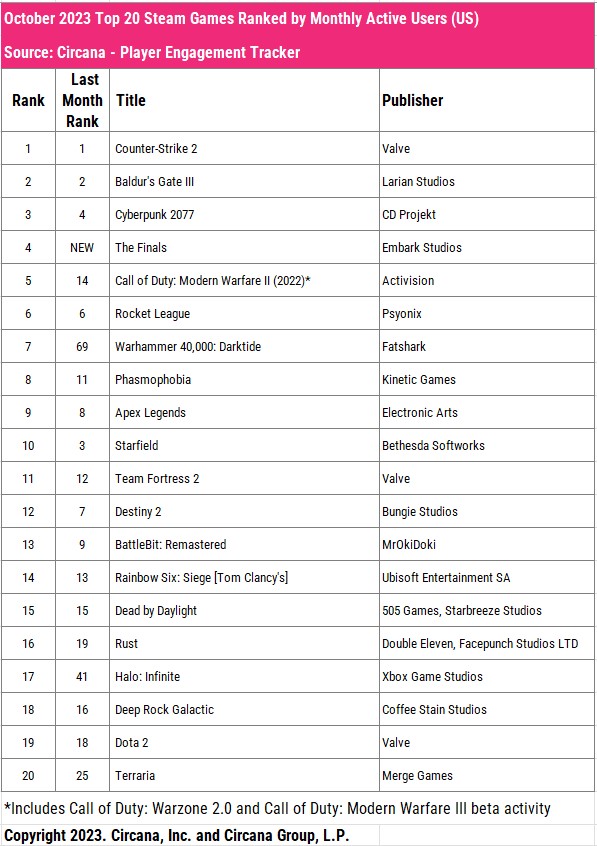
The Finals from Embark Studios held an open beta on Steam during October, helping the title rank 4th overall in Steam monthly active users in the U.S. market. Only Counter-Strike 2, Baldur’s Gate III and Cyberpunk 2077 were higher.
Mobile
Sensor Tower reports the top 10 games by Oct U.S. consumer spend and rank chg vs Sep as: MONOPOLY GO!, Royal Match, Roblox, Candy Crush Saga, Pokémon GO, Coin Master, Jackpot Party – Casino Slots (+2), Gardenscapes (-1), Township (+1), and Clash of Clans (+8).
“US mobile gaming spend in Oct 2023 showed a modest increase (+2.1%) compared to Oct 2022. The top six games remain unchanged, as MONOPOLY GO!’s revenue seems to have finally stabilized (at a velocity considerably higher than its competitors),” said Samuel Aune of Sensor Tower.
"There were a few shuffles in the bottom four of the list, but the highlight this month is Clash of Clans, which jumped up 8 places to take the #10 spot,” said Samuel Aune of Sensor Tower. “Clash of Clans showed the most growth month over month of any mobile game in Oct 2023."
Accessories
October 2023 accessories spending fell 2% when compared to a year ago, to $147 million. The PS5 Dual Sense Wireless Controller Midnight Black was the month’s best-selling accessory in consumer spending.
Software charts
Year To Date
Nintendo / PlayStation / Xbox charts are no longer being reported.
Monthly Active User Engagement
PS5
Xbox Series
Steam
Rankings
Units: PS5 > NSW > XBS
Revenue: PS5 > XBS > NSW
YTD Units: PS5 > NSW > XBS
YTD Revenue: PS5 > NSW > XBS
Thanks
Mat Piscatella!
Welfare's estimates
PS5: 320k
NSW: 210k
XBS: 200k
Full Estimations for 2023
| Month | PS5 | XBS | NSW |
|---|
| Jan-23 | 430,000 | 200,000 | 280,000 |
| Feb-23 | 560,000 | 240,000 | 290,000 |
| Mar-23 | 660,000 | 280,000 | 340,000 |
| Apr-23 | 360,000 | 180,000 | 420,000 |
| May-23 | 270,000 | 160,000 | 450,000 |
| Jun-23 | 430,000 | 240,000 | 350,000 |
| Jul-23 | 270,000 | 160,000 | 240,000 |
| Aug-23 | 360,000 | 210,000 | 200,000 |
| Sep-23 | 480,000 | 300,000 | 200,000 |
| Oct -23 | 320,000 | 200,000 | 210,000 |
| YTD | 4,150,000 | 2,170,000 | 2,980,000 |
| LTD | 16,050,000 | 11,870,000 | 42,390,000 |
Results for 2022 (NSW monthly numbers are Welfare's estimations but it's total is from NPD. PS5 and XBS monthly and total numbers are from NPD)
| Month | PS5 | XBS | NSW |
|---|
| Jan-22 | 369,000 | 307,000 | 270,000 |
| Feb-22 | 128,000 | 261,000 | 410,000 |
| Mar-22 | 282,000 | 489,000 | 540,000 |
| Apr-22 | 234,000 | 267,000 | 365,000 |
| May-22 | 119,000 | 177,000 | 270,000 |
| Jun-22 | 277,000 | 260,000 | 385,000 |
| Jul-22 | 301,000 | 147,000 | 310,000 |
| Aug-22 | 341,000 | 251,000 | 295,000 |
| Sep-22 | 494,00 | 288,000 | 325,000 |
| Oct-22 | 456,000 | 261,000 | 250,000 |
| Nov-22 | 1,328,000 | 730,000 | 920,000 |
| Dec-22 | 1,331,000 | 942,000 | 1,490,000 |
| Total | 5,660,000 | 4,480,000 | 5,830,000 |
NPD 2022 Yearly and Lifetime sales
| 2022 | LTD |
|---|
| NSW | 5,830,000 | 39,410,000 |
| PS5 | 5,660,000 | 11,900,000 |
| XBS | 4,480,000 | 9,700,000 |
| PS4 | 50,000 | 34,760,000 |


