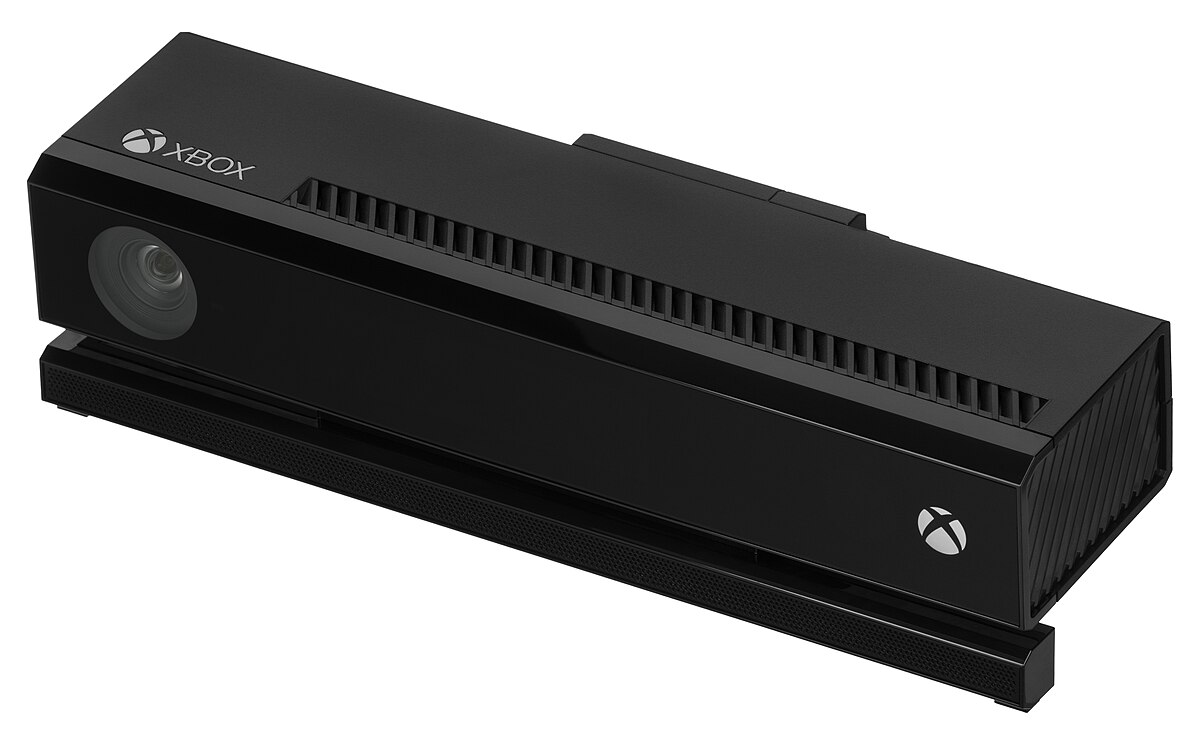
We can look at these figures at least three separate ways: absolute Kinect sales, Kinect sales against new hardware sales, or the total Kinect attach rate. In terms of absolute figures, 1 million Kinect units were sold in the first 10 days, followed by an announcement of 2.5 million in the first 25 days. After four months, the figure was up to 10 million. The next announcement I'm aware of was made at the beginning of 2012, by which point 18 million Kinect sensors had been shipped. Then in May of this year Microsoft announced that the figure was over 19 million. In five months, an additional 1 million sensors, give or take, had been shipped. If we compare Kinect sales to new system sales, we see that Microsoft sold two Kinect sensors per each console early in the system's life, but is now down below one new Kinect sensor per new console. In terms of attach rate (i.e. the fraction of the entire installed base that could have a Kinect sensor) that figure went from zero to 19 percent in the first four months that Kinect was available. By the beginning of 2012, it was up to 27 percent and has held steady there for five months. If current trends continue, I expect the numbers to show that 3 out of 10 Xbox 360 systems has a Kinect sensor, or an attach rate of 30 percent. Microsoft believes it can attract a non-traditional gaming audience with Kinect, and the $100 console is designed to appeal to that same audience. The plan, I believe, is to eliminate the Kinect-less models and put a Kinect in the box with every new console, across all prices and configurations. With service plans to subsidize lower entry-level pricing and the higher bill of material costs that comes with the Kinect hardware, Microsoft can reach out to consumers of all stripes, but casuals in particular. This is important because Microsoft's Xbox 360 division has been showing tremendous growth over the past two years. According to the company's SEC filings, the Xbox 360 business is now generating over $8 billion in revenue for the company each 12 months. The figure below shows this growth through

