DX12 Performance Discussion And Analysis Thread

a) was enabled, b) wasn't.

Place your draw and dispatch calls into the same queue, and they go into different pipelines, subject to static partitioning, with all the related downsides such as a screwed up estimation.
Still works though (like, at all), as long as Nvidia devs are adding a profile to the driver, adjusting the partitioning scheme for you. Without support by NV engineers, the driver fucks up.
Ok, which driver was this enabled in? I want to see this fuck up.

b) still doesn't work. At least not when monitoring GPU activity. There might be cases in which the driver attempts to re-assemble command buffers from multiple queues into a single one (once again only if an NV engineer hacks the the driver specifically for your game), but apart from that? No chance.
What do you mean doesn't work? I can submit draw calls to graphics queue and dispatches to compute queue and it behaves as I expect it to behave.
 
Latest AotS version (gog-1.20.20261, steam-1.20.20277) adds a new, CPU-centric benchmark scenario for DX12 mode only (at least I haven't noticed it in earlier versions). No snow whatsoever, only a single, huge map with a lot of closeups though. But high object density. New fun will arise.

edit: Looks like the new version is "HDR ready". Two new entries in settings.ini:
HDRBackBuffer and HDRScale (set to 0 and 1.000 respectively).

Poster child game incoming. ;-)


edit:
gog-version got hotfixed to the same 20227-build as steam just now
.
 
Last edited:
Latest AotS version (gog-1.20.20261, steam-1.20.20277) adds a new, CPU-centric benchmark scenario for DX12 mode only (at least I haven't noticed it in earlier versions). No snow whatsoever, only a single, huge map with a lot of closeups though. But high object density. New fun will arise.

edit: Looks like the new version is "HDR ready". Two new entries in settings.ini:
HDRBackBuffer and HDRScale (set to 0 and 1.000 respectively).

Poster child game incoming. ;-)


edit:
gog-version got hotfixed to the same 20227-build as steam just now
.
My only concern is that the benchmark may not necessarily reflect what the gamer sees/perceives, comes down to perspective and focus of the test so nothing wrong with what AoTS does but maybe FRAPs type solution would be as applicable; seems you get different results from the AoTS benchmark to that of Intel's PresentMon, and it goes beyond just fps tick sensitivity but performance trend change between AMD and Nvidia.
So maybe we will see the same situation again when comparing different CPU designs, Intel vs AMD.

Before anyone comments about PresentMon worth reading Andrew's comments: https://forum.beyond3d.com/threads/...nd-analysis-thread.57188/page-65#post-1916429
Not suggesting PresentMon is perfect solution for all the answers, but maybe it is time to show two sets of benchmark results; the internal one and also "external" such as PresentMon.
Although the challenge with PresentMon is refining the ticks and the results sensitivity.
Cheers
 
Last edited:
My only concern is that the benchmark may not necessarily reflect what the gamer sees/perceives, comes down to perspective and focus of the test so nothing wrong with what AoTS does but maybe FRAPs type solution would be as applicable; seems you get different results from the AoTS benchmark to that of Intel's PresentMon, and it goes beyond just fps tick sensitivity but performance trend change between AMD and Nvidia.
So maybe we will see the same situation again when comparing different CPU designs, Intel vs AMD.

Before anyone comments about PresentMon worth reading Andrew's comments: https://forum.beyond3d.com/threads/...nd-analysis-thread.57188/page-65#post-1916429
Not suggesting PresentMon is perfect solution for all the answers, but maybe it is time to show two sets of benchmark results; the internal one and also "external" such as PresentMon.
Although the challenge with PresentMon is refining the ticks and the results sensitivity.
Cheers

Well you can certainly make the argument that no game is reflective of what the gamer sees/perceives unless it's that game that they are playing. Just like Quake Engine games weren't necessarily reflective of what the average gamer would experience unless they were running a Quake Engine game and even then it may not have correlated with relative performance in Quake 3 (extremely popular for benchmarking back in the day).

That said it's one valid data point, but we certainly need more data points. Stardock and Oxide games plan to use the engine in other games that they publish/develop, so it'll be interesting to see if those games show similar performance characteristics. Unfortunately, Stardock mostly publishes turn based or realtime 4x games. I do wonder if any other indie developer will approach them to use the AOTS engine.

Regards,
SB
 
The problem with some built-in benchmarks is, that they are not showing what the average person would see as indicative of real-world performance. For example the scenes in the AotS benchmark, where the camera is following a couple of fighters or bombers closely is something I have never seen being done in normal gameplay, You just use the overhead camera and zoom out as much as you can (normally). That's not AotS' singular fault, a lot of benchmarks do this. Some earlier Dirt Rally Benchmarks measured pre-game cinematics into the total, the Metro benchmark tool has an extremely physics heavy second half of the run and the list goes on and on.
 
It's a tough balancing act between getting something representative of the average gamer's experience (which varies) as well as consistent reproducibility (not easy when trying to show typical gameplay where many variables are in play).

Some in game benchmarks just go for the stress as many things as much as possible. Which is sometimes good at showing worst case scenarios, but even then doesn't always show worst case scenarios as what is bad on one piece of hardware might not be as bad on another piece of hardware.

It's basically not possible to fairly represent the gameplay in all scenes, scenarios, and passages within a game with a benchmark of just a portion of a game. As bottlenecks will generally vary on a hardware by hardware basis on a scene by scene basis. A benchmark might use a section of a game that is particularly taxing on hardware A but not so taxing on hardware B. But more to a different section of the same game which isn't benchmarked and hardware B might suddenly be struggling while hardware A isn't.

Regards,
SB
 
Last edited:
Yeah those tie in as well.
But from a technical perspective it is also about showing the internal fps rendering number by the engine that also may manage smoothness/tearing/etc and also the Present fps number that looks at the numbers from the OS side after the engine.
Even Oxide in the past when articles came up with FCAT (still has a place and specific focus-context though) recommended the ideal external frame analysis to look at would be derived from EWT and they used this when Joel Hruska approached them about FCAT articles .
And now Intel's PresentMon is probably the best EWT utility example to date to analyse fps/frame performance in context mentioned a bit earlier.
But to re-iterate I see it best using both the internal benchmark and PresentMon (or something similar) from a benchmark analysis perspective, using only the internal benchmark gives a too narrow narrative-data point that can skew conclusions and opinions.
Cheers
 
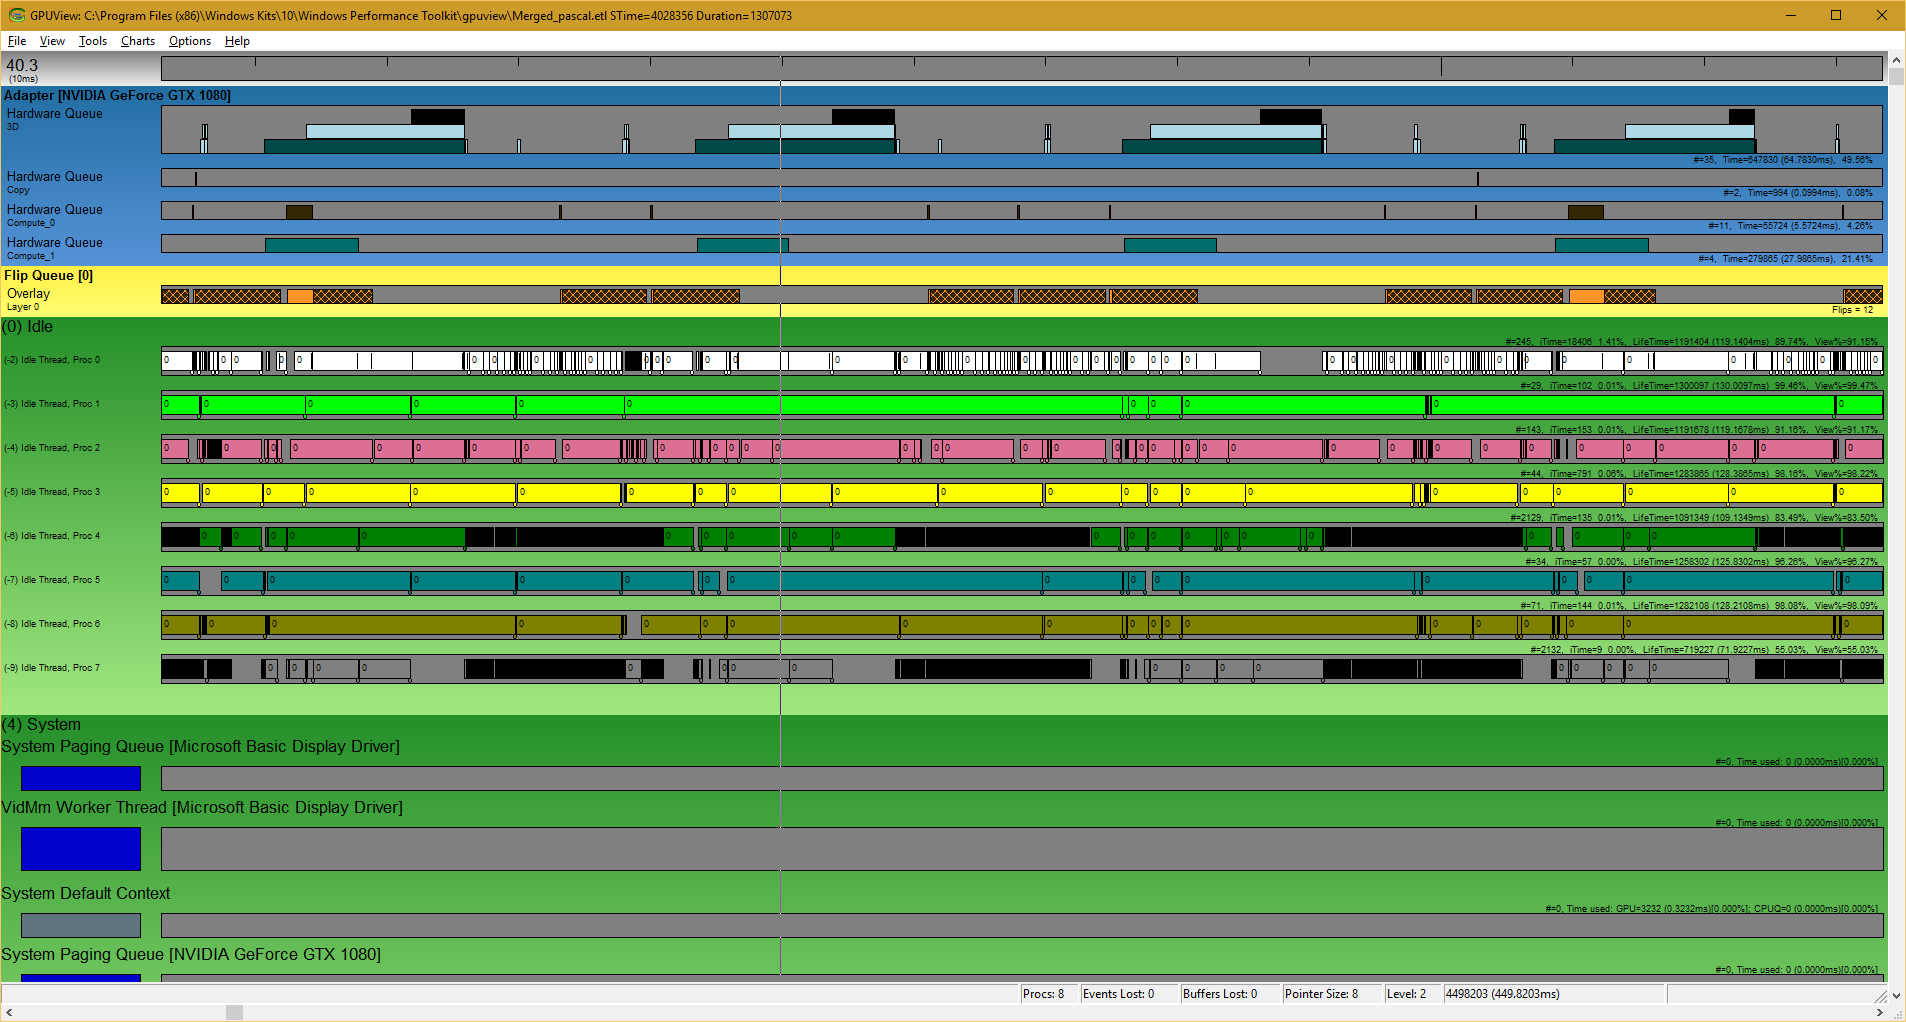
nVidia has talked about enhanced Async Compute support for Pascal but until now nobody has used GPUView to verify it. So I used MDolenc's Async Compute benchmark from last year:
pascal_async_compute10ukj.png


The Compute queue is exposed by nVidia. So there is Async Compute support!

A few other things: Until 128 kernels (i hope it was kernels) there is no performance degression with graphics+compute. After that with every 32 kernels the performance will be worse.
 

Attachments

  • perf_pascal.txt
    1.8 MB · Views: 32
Did you use the original or the new and improved version?

The compute queue should be exposed by all DX12 hardware, since it's a requirement. The concurrent execution is what it's really about.
 
Last edited:
Did you use the original or the new and improved version?

The compute queue should be exposed by all DX12 hardware, since it's a requirement. The concurrent execution is what it's really about.
Software compute queue != hardware compute queue. And no, the hardware queues could not be accessed via the corresponding software queue on Maxwell, it would only trigger activity on the 3D hardware queue instead. Activity only showed up when using CUDA, as well as some driver internal tasks like composition.
 
Maxwell shows a (single) hardware compute queue with this test setup as well.
And which activity pattern does it show? The one from #0 or #1? Because #0 appears not to be related to the running application, but rather to the aforementioned driver internal tasks.
 
That's the point I was trying to make. Just having a HW queue show up in the graph does not mean concurrent execution.
 
That's the point I was trying to make. Just having a HW queue show up in the graph does not mean concurrent execution.
Uhm, it actually does, as son as there is any activity. But it doesn't automatically indicate that the workload executed concurrently is part of your application.
 
So, being equally nitpicky, my point still stands: „Just having a HW queue show up in the graph does not mean concurrent execution.“ since I never mentioned any activity requirements.

Can we now please return to normal discussion mode? thankyouverymuch.
 
Did you use the original or the new and improved version?

This was the improved version but i still have the orginal: http://m.uploadedit.com/ba3s/1466029844663.txt

The compute queue should be exposed by all DX12 hardware, since it's a requirement. The concurrent execution is what it's really about.

The last time i checked it with Maxwell nVidia had put everything into the graphics queue. Maybe they have changed it in the last few months?!

How does Pascal hardware queues behave in an unlocked frame-rate scenario?

Hitman - Episode One - 116FPS
pascal_async_compute_hitman.png
 
Back
Top