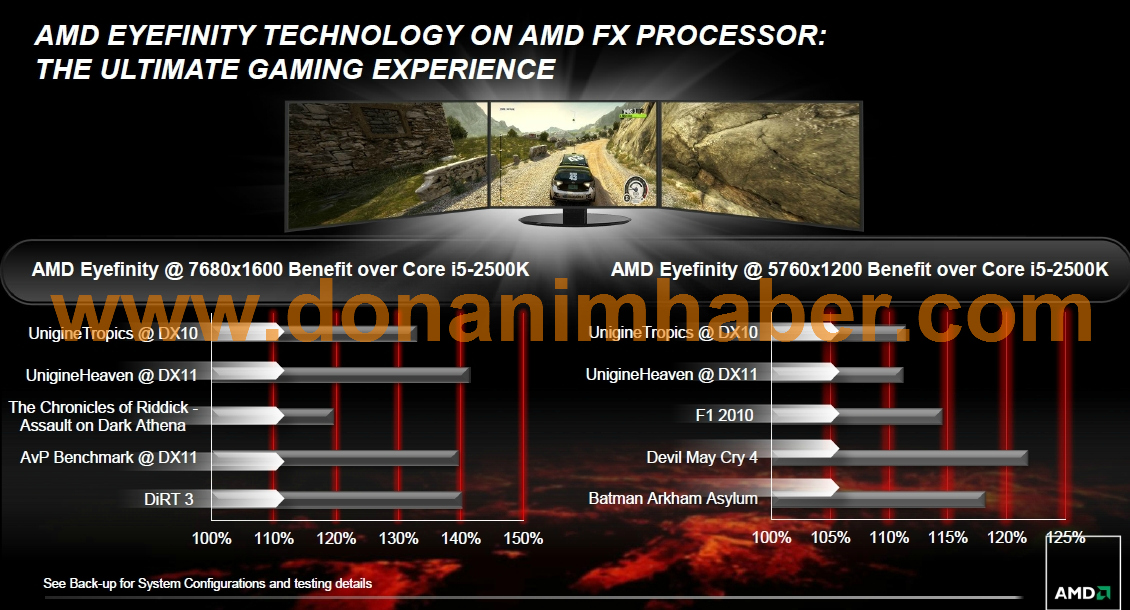
Now they have a new way to misrepresent bar charts!
Wrong way to do it:

No bar for you, competition!
Right way to do it:

So they can begin a graph from zero and actually present a sensible graph if they want to. Wow... if only they would have framerate numbers, maybe then the graph would be almost usable even if it is cherry picking!
edit: I´m assuming these are genuine AMD marketing slides, of course.
edit: It´s kind of funny though because I kind of forecasted this: http://forum.beyond3d.com/showpost.php?p=1096584&postcount=53
Now here it is, in reality. Single bar comparison graph where the competition gets no bar... and to make it worse, there is no actual framerate numbers.
Wrong way to do it:

No bar for you, competition!
Right way to do it:

So they can begin a graph from zero and actually present a sensible graph if they want to. Wow... if only they would have framerate numbers, maybe then the graph would be almost usable even if it is cherry picking!
edit: I´m assuming these are genuine AMD marketing slides, of course.
edit: It´s kind of funny though because I kind of forecasted this: http://forum.beyond3d.com/showpost.php?p=1096584&postcount=53
if you only have bar for one product and nothing to compare it to, it doesn't make sense to have any graph at all and only the numerical data becomes of interest.
In this case, to me, once I realized how skewed the graph was, the bars lost all meaning to me, the bars don't accurately describe the difference between two products unless rescaled. That said, I do give them some points back for including the actual framerate numbers. With them, there is some information in the graph left with which to work on.
Now here it is, in reality. Single bar comparison graph where the competition gets no bar... and to make it worse, there is no actual framerate numbers.
Last edited by a moderator:
