Coronavirus Pandemic (COVID-19) (SARS-CoV-2) [2020]

2019 Novel Coronavirus (SARS-CoV-2/COVID-19) for Dallas County Texas
https://www.dallascounty.org/departments/dchhs/2019-novel-coronavirus.php

July 5, 2020 - 25,840 confirmed cases - 395 deaths

25,840 confirmed cases up 1,062 and no new deaths
those 1,062 new cases represent a 4.3% increase over the last day

Increases (by percent) since March 27, 2020 :
21.0%, 19.6%, 11.1%, 12.5%, 14.9%
-- Month of April 2020 --
15.8%, 13.7%, 10.8%, 10.2%, 9.6%, 3.9%, 9.2%, 5.0%, 8.2%, 7.3%, 7.0%, 4.8%, 3.8%, 5.0%, 5.8%,
4.0%, 6.0%, 6.1%, 4.5%, 3.5%, 3.6%, 3.1%, 3.0%, 2.6%, 2.6%, 3.6%, 3.0%, 4.3%, 3.5%, 5.3%
-- Month of May 2020 --
5.3%, 4.9%, 6.0%, 5.7%, 5.9%, 5.3%, 5.2%, 4.9%, 4.7%, 4.5%, 4.3%, 3.9%, 3.8%, 3.6%, 2.9%, 3.0%,
2.8%, 3.0%, 2.9%, 2.4%, 2.3%, 2.5%, 2.0%, 2.1%, 1.9%, 2.1%, 2.1%, 2.2%, 2.1%, 2.2%, 2.3%
-- Month of June 2020 --
2.2%, 2.5%, 2.2%, 2.6%, 2.7%, 2.5%, 2.2%, 2.1%, 2.4%, 2.4%, 2.4%, 2.5%, 2.5%, 2.2%, 2.1%,
2.1%, 2.8%, 2.6%, 2.4%, 2.5%, 2.5%, 2.7%, 2.6%, 2.2%, 2.2%, 2.7%, 2.9%, 2.9%, 2.8%, 2.9%
-- Month of July 2020 --
2.5%, 3.2%, 4.8%, 4.7% and now 4.3%

Increases (by count) since March 27, 2020 :
+64, +72, +49, +61, +82
-- Month of April 2020 --
+100, +100, +90, +94, +97. +43, +106, +63, +108, +105, +107, +79, +65, +89, +109,
+80, +124, +134, +104, +84, +90, +81, +80, +71, +75, +105, +91, +135, +112, +179
-- Month of May 2020 --
+187, +181, +234, +237, +253, +246, +251, +249, +250, +251, +253, +236, +243, +235, +199, +214,
+205, +224, +225, +186, +183, +204, +172, +178, +171, +190, +197, +202, +200, +219, +228
-- Month of June 2020 --
+228, +257, +239, +285, +298, +289, +263, +254, +298, +300, +312, +328, +345, +302, +305,
+306, +413, +392, +394, +395, +408, +454, +445, +391, +403, +496, +561, +570, +572, +601
-- Month of July 2020 --
+544, +708, +1,085, +1,103 and now +1,062

As of 11:00 am July 5, 2020, DCHHS is reporting 1,062 additional positive cases of 2019 novel coronavirus (COVID-19), bringing the total case count in Dallas County to 25,840, including 395 deaths. No new deaths were reported over the past day.

An increasing proportion of COVID-19 cases in Dallas County are being diagnosed in young adults between 18 to 39 years of age, such that of all cases reported after June 1st, half have been in this age group.

Increasing reports of cases are continuing to be associated with multiple large recreational and social gatherings since the beginning of June, including house parties.

Of the almost 3,000 cases requiring hospitalization to date, more than two-thirds have been under 65 years of age, and about half do not have any high-risk chronic health conditions. Diabetes has been an underlying high-risk health condition reported in about a third of all hospitalized patients with COVID-19.

The percentage of respiratory specimens testing positive for SARS-CoV-2 increased to 33.7% among symptomatic patients presenting to area hospitals in week 26.

The age-adjusted rates of confirmed COVID-19 cases in non-hospitalized patients have been highest among Hispanics (667.4 per 100,000), Asians (187.4 per 100,000) and Blacks (136.4 per 100,000). These rates have been higher than Whites (43.8 per 100,000). Over 60% of overall COVID-19 cases to date have been Hispanic.

Of cases requiring hospitalization who reported employment, over 80% have been critical infrastructure workers, with a broad range of affected occupational sectors, including: healthcare, transportation, food and agriculture, public works, finance, communications, clergy, first responders and other essential functions.

Of the 395 total deaths reported to date, about a third have been associated with long-term care facilities.
 
State of Texas complete COVID-19 data breakdown

75af1a2d-68d9-450a-9ce9-ccd60b8fbfe3.png


https://txdshs.maps.arcgis.com/apps/opsdashboard/index.html#/ed483ecd702b4298ab01e8b9cafc8b83
https://txdshs.maps.arcgis.com/apps/opsdashboard/index.html#/0d8bdf9be927459d9cb11b9eaef6101

Data as of 7/5/2020 @3:15 PM:

Total Tests: 2,371,709 (Up +33,611)

Total Viral Tests: 2,133,457 (Up +61,648)

Only 90.0% of Total Tests are Viral Tests the other 10.0% of tests are the useless
Antibody Tests

Cases Reported: 195,239 (Up +3,449)


Fatalities: 2,637 (Up +29)

Texas tests per 1M population are 81,795 (Up +1,159) which places Texas as the 11th worst State.

Click this link: https://www.worldometers.info/coronavirus/country/us and on the page click the Tests / 1M pop column twice to sort from worst to first

They are using roughly 28.996 million as the population of Texas.

Texas is mixing Viral and Antibody Tests in the total test numbers which is very bad as Antibody Tests are useless in determining if someone has the Coronavirus.

As of today the real number of Total Viral Tests for Texas is 2,133,457 which works out to be 73,578 per 1M population so Texas is really the 7th worst state in testing
 
Cases in Texas are exploding

Last seven day's case increases are 3,449, 8,258, 7,555, 7,915, 8,076, 6,975, 4,283

First day that cases exceeded 2000 was June 10th.
First day that cases exceeded 3000 was June 17th.
First day that cases exceeded 4000 was June 20th.
First day that cases exceeded 5000 was June 23th.
First day that cases exceeded 6000 was June 30th.
First day that cases exceeded 7000 was July 1st.
First day that cases exceeded 8000 was July 1st.


The numbers of cases in Texas for each week since June 1, 2020 are :

June 1-7 : Total Cases 10,691 - Average of 1,527 per day
June 8-14 : Total Cases 12,876 - Average of 1,839 per day - 20% higher than the previous week
June 15-21 : Total Cases 22,271 - Average of 3,182 per day - 73% higher than the previous week
June 22-28 : Total Cases 37,127 - Average of 5,304 per day - 67% higher than the previous week
June 29-July 5 : Total Cases 46,511 - Average of 6,644 per day - 25% higher than the previous week
 
I have not had a chance to read all of this article but did listen to the video. The overall message seems concerning, that herd immunity may not be feasible [Trigger Warning: CNN Article]

Spain's coronavirus antibodies study adds evidence against herd immunity

Madrid (CNN) Spain's large-scale study on the coronavirus indicates just 5% of its population has developed antibodies, strengthening evidence that a so-called herd immunity to Covid-19 is "unachievable," the medical journal the Lancet reported on Monday.

The findings show that 95% of Spain's population remains susceptible to the virus. Herd immunity is achieved when enough of a population has become infected with a virus or bacteria -- or vaccinated against it -- to stop its circulation.

The European Center for Disease Control told CNN that Spain's research, on a nationwide representative sample of more than 61,000 participants, appears to be the largest study to date among a dozen serological studies on the coronavirus undertaken by European nations.

It adds to the findings of an antibody study involving 2,766 participants in Geneva, Switzerland, published in the Lancet on June 11.

There have been similar studies in China and the United States and "the key finding from these representative cohorts is that most of the population appears to have remained unexposed" to Covid-19, "even in areas with widespread virus circulation," said a Lancet commentary published along with Spain's findings.

"In light of these findings, any proposed approach to achieve herd immunity through natural infection is not only highly unethical, but also unachievable," said the Lancet's commentary authors, Isabella Eckerle, head of the Geneva Centre for Emerging Viral Diseases, and Benjamin Meyer, a virologist at the University of Geneva.

Doctors are uncertain whether having antibodies to the coronavirus means someone cannot be infected again. It's not clear how long or how well antibodies protect people from the virus.

Spain's peer-reviewed study began in April while the nation remained on a strict lockdown, and was conducted by leading government research and epidemiological agencies.

[[ Read more @ https://edition.cnn.com/2020/07/06/health/spain-coronavirus-antibody-study-lancet-intl/index.html ]]​
 
Ohio's testing is at 12.6K for the day.
Ohio is at +805 new cases, with Cuyahoga County at +159 new cases.
Test Positivity rate is around 6.38% for those new tests.

So still very much in the worst times yet. I do have some hope that people will get their act together and it won't go entirely sideways in Ohio.

Here is the trends which is using reported date and not arbitrary and incorrectly identified user reported onset date. This graphic is resized by ~ 75% and taken from the State's Current Trends page: https://coronavirus.ohio.gov/wps/portal/gov/covid-19/dashboards/current-trends

upload_2020-7-6_16-21-22.png

Here is the raw data for the last few days, filling in the limited data that is available:

upload_2020-7-6_16-20-20.png

Code:
Date; Total Tests; New Tests; Tests per 1M Population; Total Cases; Cuyahoga County Cases; Hospitalizations; Total Deaths; New Cases; New Hospitalizations; New Deaths
2020-06-14;    543,260;    7,317;    46,476;    41,148;    5,175;    6,895;    2,557;    300;    31;    3
2020-06-15;    554,128;    10,868;    47,406;    41,576;    5,220;    6,948;    2,573;    428;    53;    16
2020-06-16;    565,034;    10,906;    48,339;    42,010;    5,271;    7,007;    2,597;    434;    59;    24
2020-06-17;    581,444;    16,410;    49,743;    42,422;    5,336;    7,051;    2,611;    412;    44;    14
2020-06-18;    596,875;    15,431;    51,063;    43,122;    5,404;    7,104;    2,633;    700;    53;    22
2020-06-19;    612,854;    15,979;    52,430;    43,731;    5,481;    7,167;    2,667;    609;    63;    34
2020-06-20;    626,765;    13,911;    53,620;    44,262;    5,555;    7,201;    2,697;    531;    34;    30
2020-06-21;    639,991;    13,226;    54,752;    44,808;    5,633;    7,242;    2,700;    546;    41;    3
2020-06-22;    656,318;    16,327;    56,148;    45,537;    5,734;    7,292;    2,704;    729;    50;    4
2020-06-23;    667,077;    10,759;    57,069;    46,127;    5,820;    7,379;    2,735;    590;    87;    31
2020-06-24;    680,687;    13,610;    58,233;    46,759;    5,964;    7,447;    2,755;    632;    68;    20
2020-06-25;    696,200;    15,513;    59,560;    47,651;    6,111;    7,502;    2,772;    892;    55;    17
2020-06-26;    718,086;    21,886;    61,433;    48,638;    6,287;    7,570;    2,788;    987;    68;    16
2020-06-27;    741,353;    23,267;    63,423;    49,455;    6,429;    7,624;    2,804;    817;    54;    16
2020-06-28;    753,246;    11,893;    64,441;    50,309;    6,571;    7,681;    2,807;    854;    57;    3
2020-06-29;    770,860;    17,614;    65,947;    51,046;    6,694;    7,746;    2,818;    737;    65;    11
2020-06-30;    784,362;    13,502;    67,103;    51,789;    6,831;    7,839;    2,863;    743;    93;    45
2020-07-01;    788,403;    4,041;    67,448;    52,865;    7,013;    7,911;    2,876;    1,076;    72;    13
2020-07-02*;    789,704;    1,301;    67,560;    54,166;    7,013;    8,038;    2,886;    1,301;    127;    10
2020-07-03*;    824,481;    34,777;    70,535; 55,257;    7,392;    8,084;    2,903;    1,091;    46;    17
2020-07-04;    844,675;    20,194;    72,262;    56,183;    7,571;    8,111;    2,907;    926;    27;    4
2020-07-05;    865,069;    20,394;    74,007;    57,151;    7,724;    8,172;    2,911;    968;    61;    4
2020-07-06;    877,688;    12,619;    75,087;    57,956;    7,883;    8,249;    2,927;    805;    77;    16

Ohio also has their own Positivity Rate chart available here, but it generally lags a few days because they're using the data the tests were performed, not the date the results were reported. Overall it doesn't look entirely bad, when compared to Southern or Western States. https://coronavirus.ohio.gov/wps/portal/gov/covid-19/dashboards/key-metrics/testing

upload_2020-7-6_16-24-23.png
 
As of now, Florida is reporting +6,336 new cases since yesterday putting their 34 day surge at 149,000 total.

Arizona is at 101,441 with +3,352 new cases. Georgia is at 97,064 with +1,548 new cases for today. They're both climbing the charts.

I don't know if the slightly lower numbers are a positive sign of behaviors changing or simply an artifact of a holiday weekend where people may not have gone in to be tested.
They put policies in on June 26th to shut down alcohol at bars and limit the patrons. I suspect a lot of people were likely starting to pay attention prior to that statement as they continually soared higher.
It's been 11 or so days since the changes, perhaps this is where we will see downturn.
 
Spain's coronavirus antibodies study adds evidence against herd immunity

Madrid (CNN) Spain's large-scale study on the coronavirus indicates just 5% of its population has developed antibodies, strengthening evidence that a so-called herd immunity to Covid-19 is "unachievable," the medical journal the Lancet reported on Monday.

The findings show that 95% of Spain's population remains susceptible to the virus. Herd immunity is achieved when enough of a population has become infected with a virus or bacteria -- or vaccinated against it -- to stop its circulation.

The European Center for Disease Control told CNN that Spain's research, on a nationwide representative sample of more than 61,000 participants, appears to be the largest study to date among a dozen serological studies on the coronavirus undertaken by European nations.

It adds to the findings of an antibody study involving 2,766 participants in Geneva, Switzerland, published in the Lancet on June 11.

Spain's peer-reviewed study began in April while the nation remained on a strict lockdown, and was conducted by leading government research and epidemiological agencies.

We also have this article:

Immunity to the coronavirus is 'fragile' and 'short lived,' immunologist warns

https://www.msn.com/en-us/health/me...nd-short-lived-immunologist-warns/ar-BB16oSue

It is not a "safe bet" to rely on immunity to Covid-19 as a strategy for coping with the pandemic, one expert has warned, adding that herd immunity strategies were "probably never going to work."

Speaking to CNBC's "Squawk Box Europe" on Monday, Danny Altmann, professor of immunology at Imperial College London, said that in towns and cities where there had been coronavirus infections, only 10% to 15% of the population was likely to be immune.

"And immunity to this thing looks rather fragile — it looks like some people might have antibodies for a few months and then it might wane, so it's not looking like a safe bet," he said. "It's a very deceitful virus and immunity to it is very confusing and rather short lived."

He also raised questions about the likely success of so-called herd immunity — when a population is allowed some exposure to the virus in order to build immunity among the general population — which has been cited by health officials in Sweden, which controversially avoided a lockdown.

Despite a global race to find a vaccine for the coronavirus, experts remain uncertain about whether the antibodies present in people who have had the virus actually provide immunity to reinfection.
https://www.msn.com/en-us/health/me...nd-short-lived-immunologist-warns/ar-BB16oSue
 
2019 Novel Coronavirus (SARS-CoV-2/COVID-19) for Dallas County Texas
https://www.dallascounty.org/departments/dchhs/2019-novel-coronavirus.php

July 6, 2020 - 27,054 confirmed cases - 401 deaths

27,054 confirmed cases up 1,214 and six new deaths
those 1,214 new cases represent a 4.7% increase over the last day

The 1,214 new cases is another all time high. Not Good.

Increases (by percent) since March 27, 2020 :
21.0%, 19.6%, 11.1%, 12.5%, 14.9%
-- Month of April 2020 --
15.8%, 13.7%, 10.8%, 10.2%, 9.6%, 3.9%, 9.2%, 5.0%, 8.2%, 7.3%, 7.0%, 4.8%, 3.8%, 5.0%, 5.8%,
4.0%, 6.0%, 6.1%, 4.5%, 3.5%, 3.6%, 3.1%, 3.0%, 2.6%, 2.6%, 3.6%, 3.0%, 4.3%, 3.5%, 5.3%
-- Month of May 2020 --
5.3%, 4.9%, 6.0%, 5.7%, 5.9%, 5.3%, 5.2%, 4.9%, 4.7%, 4.5%, 4.3%, 3.9%, 3.8%, 3.6%, 2.9%, 3.0%,
2.8%, 3.0%, 2.9%, 2.4%, 2.3%, 2.5%, 2.0%, 2.1%, 1.9%, 2.1%, 2.1%, 2.2%, 2.1%, 2.2%, 2.3%
-- Month of June 2020 --
2.2%, 2.5%, 2.2%, 2.6%, 2.7%, 2.5%, 2.2%, 2.1%, 2.4%, 2.4%, 2.4%, 2.5%, 2.5%, 2.2%, 2.1%,
2.1%, 2.8%, 2.6%, 2.4%, 2.5%, 2.5%, 2.7%, 2.6%, 2.2%, 2.2%, 2.7%, 2.9%, 2.9%, 2.8%, 2.9%
-- Month of July 2020 --
2.5%, 3.2%, 4.8%, 4.7%, 4.3% and now 4.7%

Increases (by count) since March 27, 2020 :
+64, +72, +49, +61, +82
-- Month of April 2020 --
+100, +100, +90, +94, +97. +43, +106, +63, +108, +105, +107, +79, +65, +89, +109,
+80, +124, +134, +104, +84, +90, +81, +80, +71, +75, +105, +91, +135, +112, +179
-- Month of May 2020 --
+187, +181, +234, +237, +253, +246, +251, +249, +250, +251, +253, +236, +243, +235, +199, +214,
+205, +224, +225, +186, +183, +204, +172, +178, +171, +190, +197, +202, +200, +219, +228
-- Month of June 2020 --
+228, +257, +239, +285, +298, +289, +263, +254, +298, +300, +312, +328, +345, +302, +305,
+306, +413, +392, +394, +395, +408, +454, +445, +391, +403, +496, +561, +570, +572, +601
-- Month of July 2020 --
+544, +708, +1,085, +1,103, +1,062 and now +1,214

As of 11:00am July 6, 2020, Dallas County Health and Human Services is reporting 1,214 additional positive cases of 2019 novel coronavirus (COVID-19), bringing the total case count in Dallas County to 27,054, including 401 deaths.

The additional 6 deaths being reported today include:

  • A man in his 40’s was a resident of the City of DeSoto. He had been hospitalized.
  • A woman in her 50’s who was a resident of the City of Dallas. She had been critically ill in an area hospital, and had underlying high risk health conditions.
  • A man in his 60’s who was a resident of the City of Grand Prairie. He had been critically ill in an area hospital, and had underlying high risk health conditions.
  • A man in his 70’s who was a resident of the City of Dallas. He had been critically ill in an area hospital, and had underlying high risk health conditions.
  • A woman in her 80’s who was a resident of the City of Dallas. She had been critically ill in an area hospital, and did not have underlying high risk health conditions.
  • A woman in her 100’s who was a resident of a long-term care facility in the City of Dallas. She expired in the facility.
An increasing proportion of COVID-19 cases in Dallas County are being diagnosed in young adults between 18 to 39 years of age, such that of all cases reported after June 1st, half have been in this age group. Increasing reports of cases are continuing to be associated with multiple large recreational and social gatherings since the beginning of June, including house parties. Of the cases requiring hospitalization to date, more than two-thirds have been under 65 years of age, and about half do not have any high-risk chronic health conditions. Diabetes has been an underlying high-risk health condition reported in about a third of all hospitalized patients with COVID-19.

The percentage of respiratory specimens testing positive for SARS-CoV-2 increased to 33.7% among symptomatic patients presenting to area hospitals in week 26. The age-adjusted rates of confirmed COVID-19 cases in non-hospitalized patients have been highest among Hispanics (667.4 per 100,000), Asians (187.4 per 100,000) and Blacks (136.4 per 100,000). These rates have been higher than Whites (43.8 per 100,000). Over 60% of overall COVID-19 cases to date have been Hispanic. Of cases requiring hospitalization who reported employment, over 80% have been critical infrastructure workers, with a broad range of affected occupational sectors, including: healthcare, transportation, food and agriculture, public works, finance, communications, clergy, first responders and other essential functions.

Of the 401 total deaths reported to date, about a third have been associated with long-term care facilities.
 
State of Texas complete COVID-19 data breakdown

75af1a2d-68d9-450a-9ce9-ccd60b8fbfe3.png


https://txdshs.maps.arcgis.com/apps/opsdashboard/index.html#/ed483ecd702b4298ab01e8b9cafc8b83
https://txdshs.maps.arcgis.com/apps/opsdashboard/index.html#/0d8bdf9be927459d9cb11b9eaef6101

Data as of 7/6/2020 @3:50 PM:

Total Tests: 2,431,861 (Up +60,152)

Total Viral Tests: 2,163,729 (Up +30,272)

Only 89.0% of Total Tests are Viral Tests the other 11.0% of tests are the useless
Antibody Tests

Cases Reported: 200,557 (Up +5,318)


Fatalities: 2,655 (Up +18)

Texas tests per 1M population are 83,869 (Up +2,074) which places Texas as the 11th worst State.

Click this link: https://www.worldometers.info/coronavirus/country/us and on the page click the Tests / 1M pop column twice to sort from worst to first

They are using roughly 28.996 million as the population of Texas.

Texas is mixing Viral and Antibody Tests in the total test numbers which is very bad as Antibody Tests are useless in determining if someone has the Coronavirus.

As of today the real number of Total Viral Tests for Texas is 2,163,729 which works out to be 74,622 per 1M population so Texas is really the 7th worst state in testing
 
Cases in Texas have recently exploded.

The daily case increased for the last two days have averaged 4,384 which is almost 1/2 of the 8,258 case increase just three days ago.
Hope the trend continues.


Last seven day's case increases are 5,318, 3,449, 8,258, 7,555, 7,915, 8,076, 6,975

First day that cases exceeded 2000 was June 10th.
First day that cases exceeded 3000 was June 17th.
First day that cases exceeded 4000 was June 20th.
First day that cases exceeded 5000 was June 23th.
First day that cases exceeded 6000 was June 30th.
First day that cases exceeded 7000 was July 1st.
First day that cases exceeded 8000 was July 1st.


The numbers of cases in Texas for each week since June 1, 2020 are :

June 1-7 : Total Cases 10,691 - Average of 1,527 per day
June 8-14 : Total Cases 12,876 - Average of 1,839 per day - 20% higher than the previous week
June 15-21 : Total Cases 22,271 - Average of 3,182 per day - 73% higher than the previous week
June 22-28 : Total Cases 37,127 - Average of 5,304 per day - 67% higher than the previous week
June 29-July 5 : Total Cases 46,511 - Average of 6,644 per day - 25% higher than the previous week
July 6 : Total Cases 5,318 - Average of 5,318 per day - 20% lower than the previous week - Only one day for the week so far
 
As Florida sets records for Covid-19 cases, health authorities often fail to do contact tracing

https://www.msn.com/en-us/health/medical/as-florida-sets-records-for-covid-19-cases-health-authorities-often-fail-to-do-contact-tracing/ar-BB16nbsf

When Shaila Rivera and her new husband returned home from their honeymoon and tested positive for Covid-19, they expected a phone call from their local health authorities in Florida asking for a list of people they'd been near so that contact tracing could begin.

The Riveras waited for that phone call. And waited. And waited. But the call never came.

"I was shocked," said Rivera, a nurse who has since recovered from her bout with the virus.


Despite claims that Florida traces every case of Covid-19, a CNN investigation found that health authorities in Florida, now the nation's No. 1 hotspot for the virus, often fail to do contact tracing, long considered a key tool in containing an outbreak.

Florida's contact tracing challenges are indicative of how hard it is for states hard hit by Covid-19 to do proper contact tracing, which is a challenge even under the best of circumstances. The virus is so far along in states like Florida that it's a seemingly Herculean task to track down every infected person and follow up with all their close contacts.

CNN spoke with 27 Floridians, or their family members, who'd tested positive for Covid-19. Of those, only five said they had received a call from health authorities asking for their contacts.
 
Ohio's testing is at 15K for the day.
Ohio is at +948 new cases, with Cuyahoga County at +165 new cases.
Test Positivity rate is around 6.30% for those new tests.
Deaths is up to higher levels, as are hospitalizations.

So still very much in the worst times yet. I do have some hope that people will get their act together and it won't go entirely sideways in Ohio.

Here is the trends which is using reported date and not arbitrary and incorrectly identified user reported onset date. This graphic is resized by ~ 75% and taken from the State's Current Trends page: https://coronavirus.ohio.gov/wps/portal/gov/covid-19/dashboards/current-trends

upload_2020-7-7_14-58-30.png

Here is the raw data for the last few days, filling in the limited data that is available:

upload_2020-7-7_14-57-44.png

Code:
Date; Total Tests; New Tests; Tests per 1M Population; Total Cases; Cuyahoga County Cases; Hospitalizations; Total Deaths; New Cases; New Hospitalizations; New Deaths
2020-06-14;    543,260;    7,317;    46,476;    41,148;    5,175;    6,895;    2,557;    300;    31;    3
2020-06-15;    554,128;    10,868;    47,406;    41,576;    5,220;    6,948;    2,573;    428;    53;    16
2020-06-16;    565,034;    10,906;    48,339;    42,010;    5,271;    7,007;    2,597;    434;    59;    24
2020-06-17;    581,444;    16,410;    49,743;    42,422;    5,336;    7,051;    2,611;    412;    44;    14
2020-06-18;    596,875;    15,431;    51,063;    43,122;    5,404;    7,104;    2,633;    700;    53;    22
2020-06-19;    612,854;    15,979;    52,430;    43,731;    5,481;    7,167;    2,667;    609;    63;    34
2020-06-20;    626,765;    13,911;    53,620;    44,262;    5,555;    7,201;    2,697;    531;    34;    30
2020-06-21;    639,991;    13,226;    54,752;    44,808;    5,633;    7,242;    2,700;    546;    41;    3
2020-06-22;    656,318;    16,327;    56,148;    45,537;    5,734;    7,292;    2,704;    729;    50;    4
2020-06-23;    667,077;    10,759;    57,069;    46,127;    5,820;    7,379;    2,735;    590;    87;    31
2020-06-24;    680,687;    13,610;    58,233;    46,759;    5,964;    7,447;    2,755;    632;    68;    20
2020-06-25;    696,200;    15,513;    59,560;    47,651;    6,111;    7,502;    2,772;    892;    55;    17
2020-06-26;    718,086;    21,886;    61,433;    48,638;    6,287;    7,570;    2,788;    987;    68;    16
2020-06-27;    741,353;    23,267;    63,423;    49,455;    6,429;    7,624;    2,804;    817;    54;    16
2020-06-28;    753,246;    11,893;    64,441;    50,309;    6,571;    7,681;    2,807;    854;    57;    3
2020-06-29;    770,860;    17,614;    65,947;    51,046;    6,694;    7,746;    2,818;    737;    65;    11
2020-06-30;    784,362;    13,502;    67,103;    51,789;    6,831;    7,839;    2,863;    743;    93;    45
2020-07-01;    788,403;    4,041;    67,448;    52,865;    7,013;    7,911;    2,876;    1,076;    72;    13
2020-07-02*;    789,704;    1,301;    67,560;    54,166;    7,013;    8,038;    2,886;    1,301;    127;    10
2020-07-03*;    824,481;    34,777;    70,535; 55,257;    7,392;    8,084;    2,903;    1,091;    46;    17
2020-07-04;    844,675;    20,194;    72,262;    56,183;    7,571;    8,111;    2,907;    926;    27;    4
2020-07-05;    865,069;    20,394;    74,007;    57,151;    7,724;    8,172;    2,911;    968;    61;    4
2020-07-06;    877,688;    12,619;    75,087;    57,956;    7,883;    8,249;    2,927;    805;    77;    16
2020-07-07;    892,731;    15,043;    76,374;    58,904;    8,048;    8,383;    2,970;    948;    134;    43
 
As of now, Florida is reporting +7,347 new cases since yesterday putting their 35 day surge at 156,347 total.

Arizona is at 105,094 with +3,653 new cases.
Georgia is at 100,470 with +3,406 new cases.

Massachusetts is at 110,338 with +201 new cases. So in two days will be passed by Arizona and likely four days passed by Georgia.
 
2019 Novel Coronavirus (SARS-CoV-2/COVID-19) for Dallas County Texas
https://www.dallascounty.org/departments/dchhs/2019-novel-coronavirus.php

July 7, 2020 - 28,131 confirmed cases - 410 deaths

28,131 confirmed cases up 1,077 and nine new deaths
those 1,077 new cases represent a 4.0% increase over the last day

Increases (by percent) since March 27, 2020 :
21.0%, 19.6%, 11.1%, 12.5%, 14.9%
-- Month of April 2020 --
15.8%, 13.7%, 10.8%, 10.2%, 9.6%, 3.9%, 9.2%, 5.0%, 8.2%, 7.3%, 7.0%, 4.8%, 3.8%, 5.0%, 5.8%,
4.0%, 6.0%, 6.1%, 4.5%, 3.5%, 3.6%, 3.1%, 3.0%, 2.6%, 2.6%, 3.6%, 3.0%, 4.3%, 3.5%, 5.3%
-- Month of May 2020 --
5.3%, 4.9%, 6.0%, 5.7%, 5.9%, 5.3%, 5.2%, 4.9%, 4.7%, 4.5%, 4.3%, 3.9%, 3.8%, 3.6%, 2.9%, 3.0%,
2.8%, 3.0%, 2.9%, 2.4%, 2.3%, 2.5%, 2.0%, 2.1%, 1.9%, 2.1%, 2.1%, 2.2%, 2.1%, 2.2%, 2.3%
-- Month of June 2020 --
2.2%, 2.5%, 2.2%, 2.6%, 2.7%, 2.5%, 2.2%, 2.1%, 2.4%, 2.4%, 2.4%, 2.5%, 2.5%, 2.2%, 2.1%,
2.1%, 2.8%, 2.6%, 2.4%, 2.5%, 2.5%, 2.7%, 2.6%, 2.2%, 2.2%, 2.7%, 2.9%, 2.9%, 2.8%, 2.9%
-- Month of July 2020 --
2.5%, 3.2%, 4.8%, 4.7%, 4.3%, 4.7% and now 4.0%

Increases (by count) since March 27, 2020 :
+64, +72, +49, +61, +82
-- Month of April 2020 --
+100, +100, +90, +94, +97. +43, +106, +63, +108, +105, +107, +79, +65, +89, +109,
+80, +124, +134, +104, +84, +90, +81, +80, +71, +75, +105, +91, +135, +112, +179
-- Month of May 2020 --
+187, +181, +234, +237, +253, +246, +251, +249, +250, +251, +253, +236, +243, +235, +199, +214,
+205, +224, +225, +186, +183, +204, +172, +178, +171, +190, +197, +202, +200, +219, +228
-- Month of June 2020 --
+228, +257, +239, +285, +298, +289, +263, +254, +298, +300, +312, +328, +345, +302, +305,
+306, +413, +392, +394, +395, +408, +454, +445, +391, +403, +496, +561, +570, +572, +601
-- Month of July 2020 --
+544, +708, +1,085, +1,103, +1,062, +1,214 and now +1,077

As of 11:00am July 7, 2020, Dallas County Health and Human Services is reporting 1,077 additional positive cases of 2019 novel coronavirus (COVID-19), bringing the total case count in Dallas County to 28,131, including 410 deaths.

The additional 9 deaths being reported today include:

  • A man in his 60’s who was a resident of the City of Dallas. He had been critically ill in an area hospital, and did not have underlying high risk health conditions.
  • A man in his 60’s who was a resident of the City of Mesquite. He expired in an area hospital ED, and did not have underlying high risk health conditions.
  • A woman in her 70’s who was a resident of a long-term care facility in the City of DeSoto. She had been critically ill in an area hospital, and did not have underlying high risk health conditions.
  • A man in his 70’s who was a resident of a long-term care facility in the City of Dallas. He had been critically ill in an area hospital, and had underlying high risk health conditions.
  • A woman in her 80’s who was a resident of the City of Dallas. She had been critically ill in an area hospital, and did not have underlying high risk health conditions.
  • A man in his 80’s who was a resident of a long-term care facility in the City of DeSoto. He had been hospitalized, and did not have underlying high risk health conditions.
  • A man in his 80’s who was a resident of a long-term care facility in the City of DeSoto. He expired in an area hospital ED, and did not have underlying high risk health conditions.
  • A man in his 90’s who was a resident of the City of Mesquite. He had been critically ill in an area hospital, and had underlying high risk health conditions.
  • A man in his 90’s who was a resident of a long-term care facility in the City of Mesquite. He had been critically ill in an area hospital, and did not have underlying high risk health conditions.
An increasing proportion of COVID-19 cases in Dallas County are being diagnosed in young adults between 18 to 39 years of age, such that of all cases reported after June 1st, half have been in this age group. Increasing reports of cases are continuing to be associated with multiple large recreational and social gatherings since the beginning of June, including house parties. Of the cases requiring hospitalization to date, more than two-thirds have been under 65 years of age. Diabetes has been an underlying high-risk health condition reported in about a third of all hospitalized patients with COVID-19.

The percentage of respiratory specimens testing positive for SARS-CoV-2 increased to 32% among symptomatic patients presenting to area hospitals in week 26. The age-adjusted rates of confirmed COVID19 cases in non-hospitalized patients have been highest among Hispanics (667.4 per 100,000), Asians (187.4 per 100,000) and Blacks (136.4 per 100,000). These rates have been higher than Whites (43.8 per 100,000). Over 60% of overall COVID-19 cases to date have been Hispanic. Of cases requiring hospitalization who reported employment, over 80% have been critical infrastructure workers, with a broad range of affected occupational sectors, including: healthcare, transportation, food and agriculture, public works, finance, communications, clergy, first responders and other essential functions.

Of the 410 total deaths reported to date, about a third have been associated with long-term care facilities.
 
State of Texas complete COVID-19 data breakdown

75af1a2d-68d9-450a-9ce9-ccd60b8fbfe3.png


https://txdshs.maps.arcgis.com/apps/opsdashboard/index.html#/ed483ecd702b4298ab01e8b9cafc8b83
https://txdshs.maps.arcgis.com/apps/opsdashboard/index.html#/0d8bdf9be927459d9cb11b9eaef6101

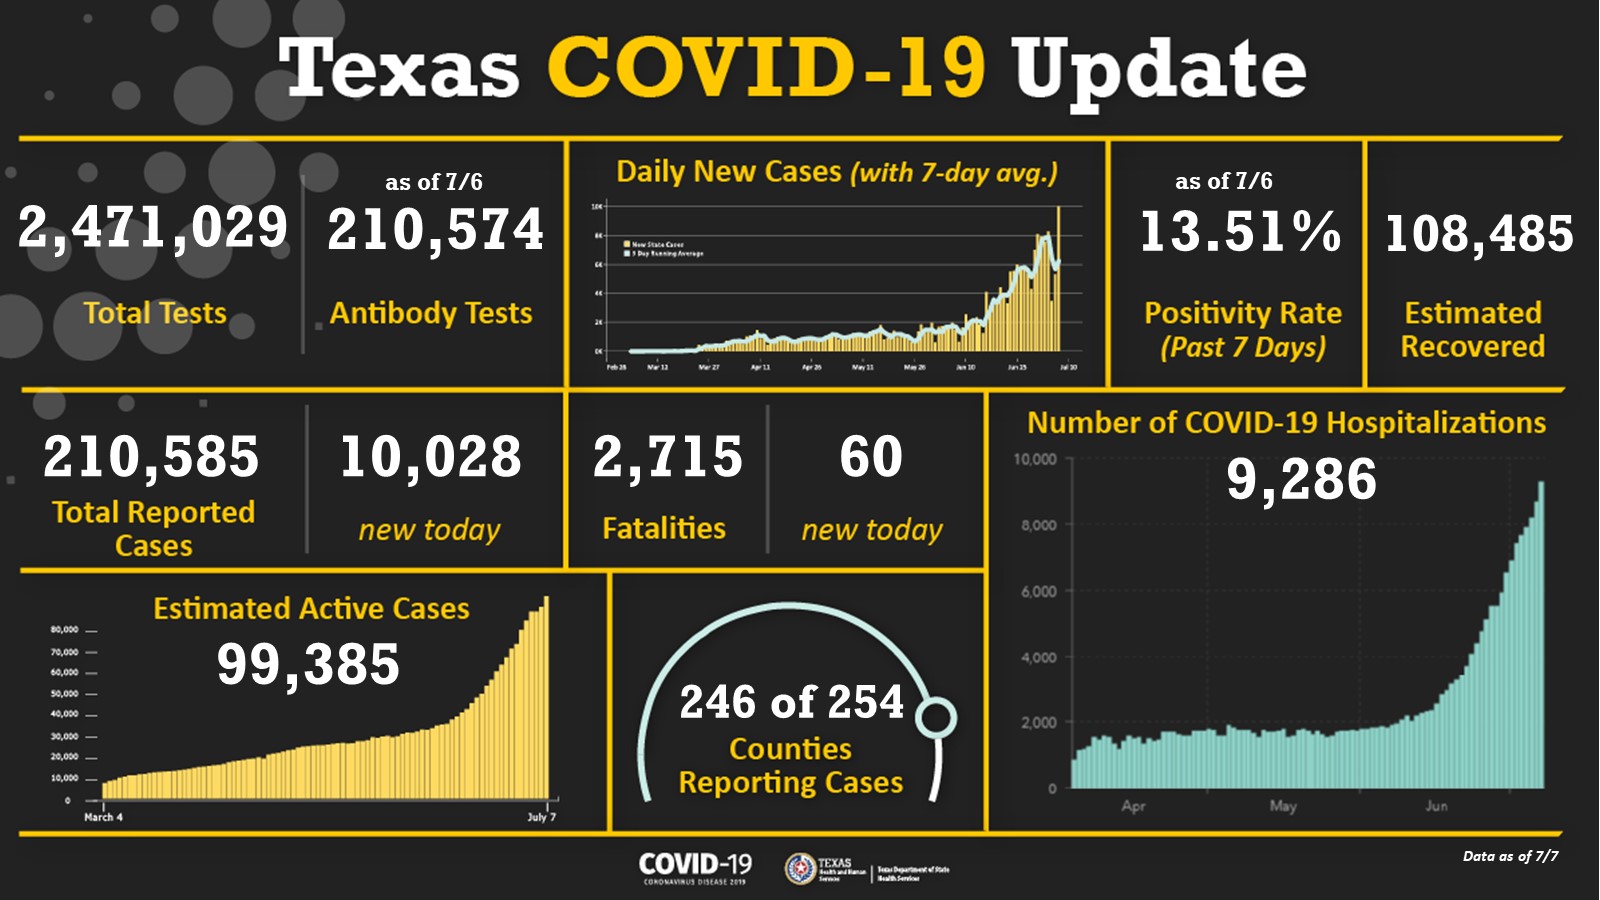
Data as of 7/7/2020 @3:50 PM:

Total Tests: 2,471,029 (Up +39,168)

Total Viral Tests: 2,221,287 (Up +57,558)

Only 89.9% of Total Tests are Viral Tests the other 10.1% of tests are the useless
Antibody Tests

Cases Reported: 210,585 (Up +10,028)


Fatalities: 2,715 (Up +60)

Texas tests per 1M population are 85,220 (Up +1,351) which places Texas as the 11th worst State.

Click this link: https://www.worldometers.info/coronavirus/country/us and on the page click the Tests / 1M pop column twice to sort from worst to first

They are using roughly 28.996 million as the population of Texas.

Texas is mixing Viral and Antibody Tests in the total test numbers which is very bad as Antibody Tests are useless in determining if someone has the Coronavirus.

As of today the real number of Total Viral Tests for Texas is 2,221,287 which works out to be 76,607 per 1M population so Texas is really the 8th worst state in testing
 
Cases in Texas are exploding.

The daily case increased for the two previous days had averaged 4,384 which was almost 1/2 of the 8,258 case increase just four days ago.
But that turned out to be an aberration as today's case increase of 10,028 is again a new all time high. Not Good.


Last seven day's case increases are 10,028, 5,318, 3,449, 8,258, 7,555, 7,915, 8,076

First day that cases exceeded 2000 was June 10th.
First day that cases exceeded 3000 was June 17th.
First day that cases exceeded 4000 was June 20th.
First day that cases exceeded 5000 was June 23th.
First day that cases exceeded 6000 was June 30th.
First day that cases exceeded 7000 was July 1st.
First day that cases exceeded 8000 was July 1st.
First day that cases exceeded 9000 was July 7th.
First day that cases exceeded 10000 was July 7th.


The numbers of cases in Texas for each week since June 1, 2020 are :

June 1-7 : Total Cases 10,691 - Average of 1,527 per day
June 8-14 : Total Cases 12,876 - Average of 1,839 per day - 20% higher than the previous week
June 15-21 : Total Cases 22,271 - Average of 3,182 per day - 73% higher than the previous week
June 22-28 : Total Cases 37,127 - Average of 5,304 per day - 67% higher than the previous week
June 29-July 5 : Total Cases 46,511 - Average of 6,644 per day - 25% higher than the previous week
July 6-7 : Total Cases 15,346 - Average of 7,673 per day - 15% higher than the previous week - Only two days for the week so far
 
Back
Top