
It would be plausible, if you push the bottleneck to IO. If there is no IO bottleneck than what happens in the GPU will be the same.And you believe that? I can't remember the last time increasing texture detail/resolution in a game affected frame rate (As long as there's enough VRAM) so find it hard to believe.
Higher quality textures are basically 'free' on PC (again as long as you have enough VRAM) and have been for years.
You are using an out of date browser. It may not display this or other websites correctly.
You should upgrade or use an alternative browser.
You should upgrade or use an alternative browser.
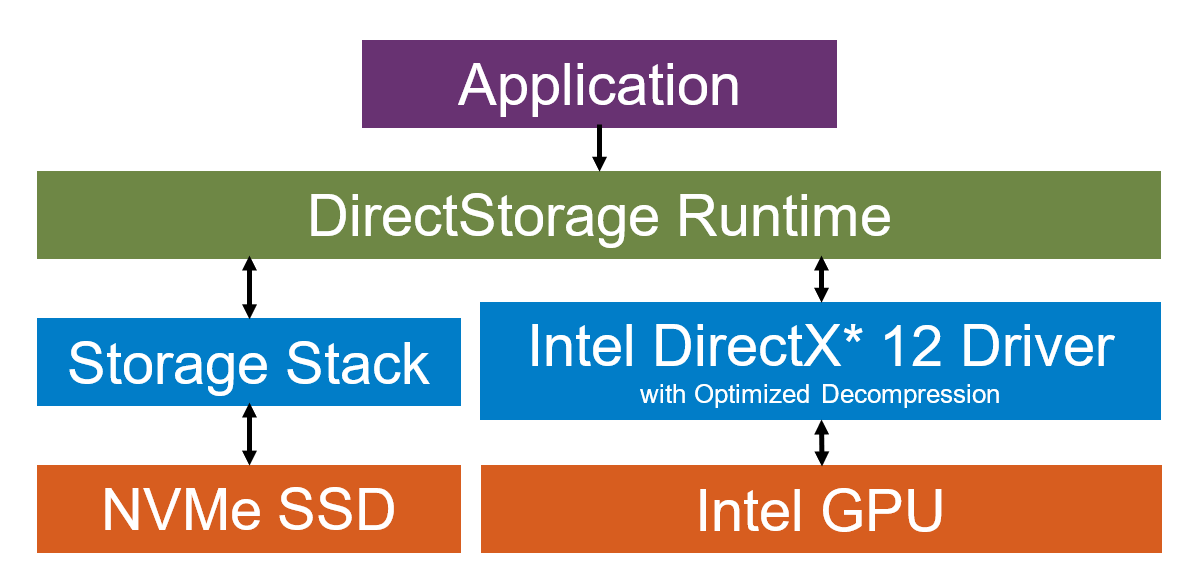
Next-Generation NVMe SSD and I/O Technology [PC, PS5, XBSX|S]
- Thread starter Shortbread
- Start date
Inuhanyou
Veteran
That's close to ps3 and 360 bandwidth(sans edram). Crazy.I seem to recall someone arguing a while back in this thread (I don't recall who) that GPU's wouldn't be able to keep up with PS5's decompression rate. I may be misrepresenting that argument, but in any case, as a reference point here's an example of a 3080Ti sustaining over 18GB/s uncompressed at around 6.8GB/sec input using Direct Storage:

GitHub - GameTechDev/SamplerFeedbackStreaming: This sample uses D3D12 Sampler Feedback and DirectStorage as part of an asynchronous texture streaming solution.
This sample uses D3D12 Sampler Feedback and DirectStorage as part of an asynchronous texture streaming solution. - GameTechDev/SamplerFeedbackStreaming
 github.com
The Intel Expanse demo use a virtual texturing system using Sampler Feedback streaming
Test of the SSD with the optimized for Direct storage firmware
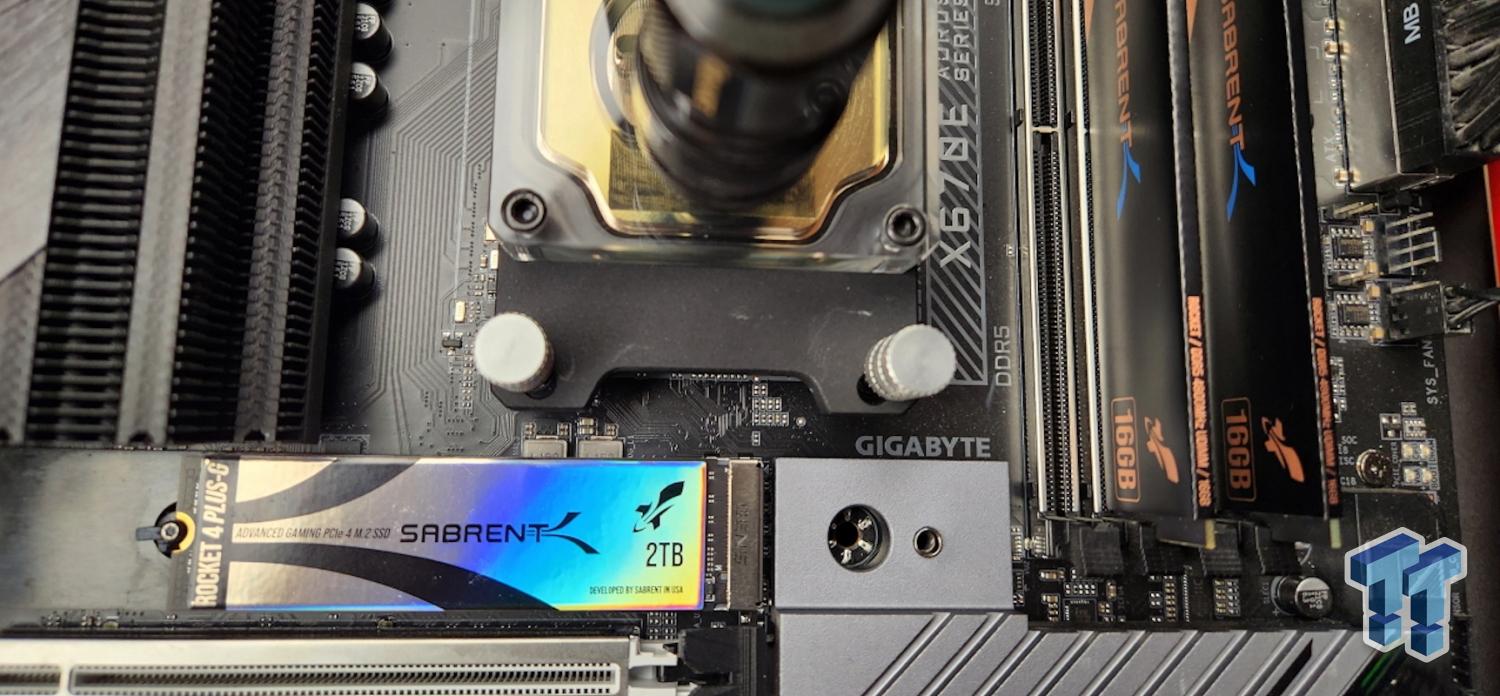
Sabrent Rocket 4 Plus-G 2TB SSD Review - Direct Storage Supremacy
Direct Storage is on its way and is set to change how gaming assets are delivered to your GPU, only one company stands ready to fully deliver - Sabrent!
 www.tweaktown.com
Last edited:
I question those Sabrent results.. because I've noticed that the very first "test" that is run when the app loads, always shows way higher bandwidth than if you let it run and it refreshes(reloads) a second time...
For example:
WDSN850(1TB, 7GB/s Gen4 drive)
Very first result when app loads initially:

Second result when app refreshes after a few seconds:

As you can see, bandwidth drops heavily from 19.59GB/s to 11.62GB/s. The actual results are representative of the 2nd run and subsequent runs, because you can let it run and continually refresh, and all results after that initial one will be very similar.
I've got about 5 different drives, and I'm quickly testing them to see how they perform based on the 2nd reload. I'll post the results once I have them.
For example:
WDSN850(1TB, 7GB/s Gen4 drive)
Very first result when app loads initially:
Second result when app refreshes after a few seconds:
As you can see, bandwidth drops heavily from 19.59GB/s to 11.62GB/s. The actual results are representative of the 2nd run and subsequent runs, because you can let it run and continually refresh, and all results after that initial one will be very similar.
I've got about 5 different drives, and I'm quickly testing them to see how they perform based on the 2nd reload. I'll post the results once I have them.
Ok my results for various drives I have on hand:
WDSN850 (1TB, 7GB/s Gen4)
970EVOPlus (500GB, 3.5GB/s Gen3)

A400 (1TB, 500MB/s SATASSD)

850EVO (500GB, 550MB/s SATA)

840EVO (250GB, 550MB/s SATA)

So it appears that 3.5GB/s is the sweet spot, at least for this particular demo. Unless there's just something wrong with my setup that I'm not aware of.
The two Samsung EVO SATA SSDs performed admirably. However, the Kingston A400 drive was actually an interesting case because the demo could just BARELY load the results in time before the test was designed to reload again. I guess it reloads every 12 seconds or so, and I just barely caught the results before it would reload lol. The A400 results stand out obviously, but I believe that particular drive doesn't have DRAM cache which destroys performance.
WDSN850 (1TB, 7GB/s Gen4)
970EVOPlus (500GB, 3.5GB/s Gen3)
A400 (1TB, 500MB/s SATASSD)
850EVO (500GB, 550MB/s SATA)
840EVO (250GB, 550MB/s SATA)
So it appears that 3.5GB/s is the sweet spot, at least for this particular demo. Unless there's just something wrong with my setup that I'm not aware of.
The two Samsung EVO SATA SSDs performed admirably. However, the Kingston A400 drive was actually an interesting case because the demo could just BARELY load the results in time before the test was designed to reload again.
I guess it reloads every 12 seconds or so, and I just barely caught the results before it would reload lol. The A400 results stand out obviously, but I believe that particular drive doesn't have DRAM cache which destroys performance.Ok my results for various drives I have on hand:
WDSN850 (1TB, 7GB/s Gen4)
970EVOPlus (500GB, 3.5GB/s Gen3)
A400 (1TB, 500MB/s SATASSD)
850EVO (500GB, 550MB/s SATA)
840EVO (250GB, 550MB/s SATA)
So it appears that 3.5GB/s is the sweet spot, at least for this particular demo. Unless there's just something wrong with my setup that I'm not aware of.
The two Samsung EVO SATA SSDs performed admirably. However, the Kingston A400 drive was actually an interesting case because the demo could just BARELY load the results in time before the test was designed to reload again.
Thanks for the benchmarking and results. A400 (kingston) is DRAM-less which explains your results, for that kind of operations its terrible. Its the cheapest entry sata SSD (20usd for 240gb), its not that bad considering its price for normal/light usage. For direct storage.... nah
 The smaller the drive the slower its going to be (A400).
Crazy fast speeds for nvme and very reasonable speeds for sata ssd's too, the ones with dram that is.
D
Deleted member 11852
Guest
I question those Sabrent results.. because I've noticed that the very first "test" that is run when the app loads, always shows way higher bandwidth than if you let it run and it refreshes(reloads) a second time...
This is consistent with cache techniques employed in most modern I/O systems. The use of cache, whether adjacent to the drive controller or employed by the OS has existed for a long time but you're never really exposed to it. Microsoft describe caching I/O as it was first implemented in Windows for Win32 API apps have existed - so Windows 95 onwards.
All these tests demonstrate is that for a second run, data did not need to be pulled from the drive, but from cache. Windows 10 and 11 are fairly smart about using excess RAM for I/O cache, but Windows is not omniscient so applications/games manually allocating RAM as a managed cache anticipating future I/O needs (like re-loads) is better. I assume this is what Returnal does with 32Gb recommendation for HDD systems.
Last edited by a moderator:
Rootax
Veteran
Cool gain from sata ssd to gen3 nvme. I'll need to buy one for next direct storage gamesOk my results for various drives I have on hand:
WDSN850 (1TB, 7GB/s Gen4)
970EVOPlus (500GB, 3.5GB/s Gen3)
A400 (1TB, 500MB/s SATASSD)
850EVO (500GB, 550MB/s SATA)
840EVO (250GB, 550MB/s SATA)
So it appears that 3.5GB/s is the sweet spot, at least for this particular demo. Unless there's just something wrong with my setup that I'm not aware of.
The two Samsung EVO SATA SSDs performed admirably. However, the Kingston A400 drive was actually an interesting case because the demo could just BARELY load the results in time before the test was designed to reload again.
Silent_Buddha
Legend
This is consistent with cache techniques employed in most modern I/O systems. The use of cache, whether adjacent to the drive controller or employed by the OS has existed for a long time but you're never really exposed to it. Microsoft describe caching I/O as it was first implemented in Windows for Win32 API apps have existed - so Windows 95 onwards.
All these tests demonstrate is that for a second run, data did not need to be pulled from the drive, but from cache. Windows 10 and 11 are fairly smart about using excess RAM for I/O cache, but Windows is not omniscient so applications/games manually allocating RAM as a managed cache anticipating future I/O needs (like re-loads) is better. I assume this is what Returnal does with 32Gb recommendation for HDD systems.
That's the opposite of what the application is doing however. If this was the cause then the 2nd and subsequent runs should see an increase in bandwidth (loading from cache instead of media), not a decrease in bandwidth.
IMO, the application is just poorly written (WRT how it's determining the time it takes to load everything in). IE - likely a lazy and poorly written timing implementation that is being thrown off (tiny pauses/interruptions) while other things within the application are being instantiated leading to the first run recording a lower "time" for loading the assets which then leads to an inflated bandwidth number. Later runs without the application instantiating things because it's all up and running now allow the timing implementation to correctly record (or at least more correctly record depending on just how badly written the timing implementation is
) how much time it takes to load the data.Regards,
SB
D
Deleted member 11852
Guest
That's the opposite of what the application is doing however. If this was the cause then the 2nd and subsequent runs should see an increase in bandwidth (loading from cache instead of media), not a decrease in bandwidth.
Whilst I am not familiar with the application I am to familiar with the mechanisms that exist in the Windows device subsystems that can be used to measure bandwidth. Because of the transparent way in which Windows uses cache, a 'drop' in bandwidth is merely showing less data being read from the drive. Again this is consistent with data from cache.
Ignoring cache usage, I/O bandwidth can genuinely drop depending on the increasing thermals of the components in question. But not if the benchmark is recording faster loads. That's definitely OS cache at play.
Silent_Buddha
Legend
Whilst I am not familiar with the application I am to familiar with the mechanisms that exist in the Windows device subsystems that can be used to measure bandwidth. Because of the transparent way in which Windows uses cache, a 'drop' in bandwidth is merely showing less data being read from the drive. Again this is consistent with data from cache.
Ignoring cache usage, I/O bandwidth can genuinely drop depending on the increasing thermals of the components in question. But not if the benchmark is recording faster loads. That's definitely OS cache at play.
This flies opposite of everything I've ever seen in benchmarking software for storage. You ignore the first run if you are evaluating the effectiveness of cache because it is usually the slowest and almost never the fastest. It's because the 2nd and subsequent runs will have the data cached whereas the first run does not.
For people who don't know how to disable Windows caching, it is recommended to only use the first benchmark run and ignore the 2nd and subsquent runs because those will potentially be faster due to Windows caching.
The application is reading in how quickly the application loads the data and not how quickly it is being read off the media (hence the inclusion of GDEFLATE to benchmark the inline decompression of the data). The final Bandwidth number is how quickly VRAM can be populated with uncompressed data (source file being a compressed file or files) when reading from compressed files stored on a storage medium directly into GPU VRAM.
If that data was being cached (decompressed from system RAM) then the bandwidth numbers for the process would be significantly higher. As well, the 2nd and subsequent runs would normalize between drives as the contribution from drives approaches 0 due to caching of data.
Of course, processing the data from system RAM (cache) would defeat the whole purpose of the benchmark and DirectStorage and invalidate any claims regarding DirectStorage (near instant random access to data at high speed).
That said, it would be interesting to run the benchmark on a system with only 1-2 GB of system RAM with a GPU with a sufficiently large pool of VRAM.
Regards,
SB
Last edited:
You pretty much said exactly what I was going to say, but I couldn't respond until now because I was having issues with my phone earlier today. Yea, I just think that when the app is initialized it messes with how the bandwidth is calculated for that first run so it produces an inflated score the first time.. and yeah, bandwidth would be higher if it was cached after first run. And I was also going to say that it would completely ruin the entire point of the benchmark in the first place if it was just presenting cached bandwidth numbers.That's the opposite of what the application is doing however. If this was the cause then the 2nd and subsequent runs should see an increase in bandwidth (loading from cache instead of media), not a decrease in bandwidth.
IMO, the application is just poorly written (WRT how it's determining the time it takes to load everything in). IE - likely a lazy and poorly written timing implementation that is being thrown off (tiny pauses/interruptions) while other things within the application are being instantiated leading to the first run recording a lower "time" for loading the assets which then leads to an inflated bandwidth number. Later runs without the application instantiating things because it's all up and running now allow the timing implementation to correctly record (or at least more correctly record depending on just how badly written the timing implementation is
Regards,
SB
However, if Compusemble sees that continued bandwidth as the app continually refreshes... then I dunno.. that SSD must be special indeed, and maybe my SSD just isn't as good. I just question it because it almost seems like an advertisement for the Sabrent SSD.. and I thought maybe they could be taking the higher inflated bandwidth scores and comparing them to less favorable results from other drives.
Not making any accusations really, but the high bandwidth just reminded me that mine always was really high the first run, and then much lower the subsequent runs.
You have to download it from Github and then build it with VisualStudio.sorry where is this benchmark ? I have a bunch of drives I can test it on
If you give me a second, and trust me, I can upload the demo to google for you to try
Edit:
Bulkloaddemo – Google Drive
 drive.google.com
Select everything there and download.
If you run the exe as is, it will run with GPU decompression enabled. If you want to switch it and run with CPU decompression, from a command prompt run "Bulkloaddemo -gpu-decompression 0" (and use 1 if you want GPU decompression)
Last edited:
Yea maybe after 5 minutes... not literally just 12 seconds laterWhilst I am not familiar with the application I am to familiar with the mechanisms that exist in the Windows device subsystems that can be used to measure bandwidth. Because of the transparent way in which Windows uses cache, a 'drop' in bandwidth is merely showing less data being read from the drive. Again this is consistent with data from cache.
Ignoring cache usage, I/O bandwidth can genuinely drop depending on the increasing thermals of the components in question. But not if the benchmark is recording faster loads. That's definitely OS cache at play.
Rootax
Veteran
You have to download it from Github and then build it with VisualStudio.
If you give me a second, and trust me, I can upload the demo to google for you to try
Edit:
Bulkloaddemo – Google Drive
Select everything there and download.
If you run the exe as is, it will run with GPU decompression enabled. If you want to switch it and run with CPU decompression, from a command prompt run "Bulkloaddemo -gpu-decompression 0" (and use 1 if you want GPU decompression)
That's very nice of you, thx !
Caching shouldn't factor into it as each loading iteration always reads the exact same 1.621.803.008 bytes from disk. Those reads all come from the same ~2.2MB avocado.marc file which is read multiple times every iteration.Whilst I am not familiar with the application I am to familiar with the mechanisms that exist in the Windows device subsystems that can be used to measure bandwidth. Because of the transparent way in which Windows uses cache, a 'drop' in bandwidth is merely showing less data being read from the drive. Again this is consistent with data from cache.
Ignoring cache usage, I/O bandwidth can genuinely drop depending on the increasing thermals of the components in question. But not if the benchmark is recording faster loads. That's definitely OS cache at play.
I also saw this same behavior in the Intel SFS demo. I'm not sure if bypassing the file cache is necessary for DirectStorage but it definitely does so in these two demos.
Rootax
Veteran
So I was surprised by the resultats given i've only a sata ssd for gaming right now (Samsung 850 Evo 1Tb, and 3090 on a pci gen3 slot)

Then I remembered I have primocache activated on this drive. So, without it (I see the drive reading at full speed during loading now) :

The GPU is working a lot during the loading btw. I wonder if badly tuned engine could kill the framerate during loading of assets because of the spike in gpu usage....
Then I remembered I have primocache activated on this drive. So, without it (I see the drive reading at full speed during loading now) :
The GPU is working a lot during the loading btw. I wonder if badly tuned engine could kill the framerate during loading of assets because of the spike in gpu usage....
D
Deleted member 11852
Guest
This flies opposite of everything I've ever seen in benchmarking software for storage. You ignore the first run if you are evaluating the effectiveness of cache because it is usually the slowest and almost never the fastest. It's because the 2nd and subsequent runs will have the data cached whereas the first run does not.
Exactly, is the benchmark measuring the bandwidth of the I/O from disk or the effectiveness of cache? Because the latter will impact the former because it's reducing the need to load data from disk, which is why bandwidth drops.
What is it you are intending to measure? Because applications can disable Windows caching I/O, but I do not think you can disable any onboard cache that is part of the drive, although that tends to be relatively small.
For people who don't know how to disable Windows caching, it is recommended to only use the first benchmark run and ignore the 2nd and subsquent runs because those will potentially be faster due to Windows caching.
The user can disable Windows write-behind caching (which doesn't help in this scenario), but users cannot disable Windows I/O cache, only the application can do this through API calls which tells the loader not to cache a particular read. This is rarely used outside of filesystem copying operations because there is no need to cache files being copied.
If there is some way to do this, I'd be interested to see it documented!
davis.anthony
Veteran
Can someone load up GPU-Z or MSI Afterburner to see what the GPU use is when using GPU decompression?
Similar threads
- Replies
- 20
- Views
- 2K
- Replies
- 52
- Views
- 5K