Jon Peddie GPU share

tangey

Veteran
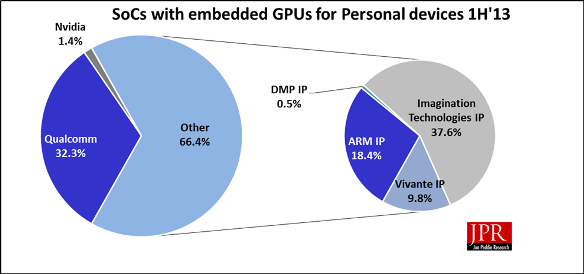
JPR posted some figures about GPU share.

http://jonpeddie.com/publications/mobile-devices-and-the-gpus-inside/
newchart%20PR.png


Which is interesting.

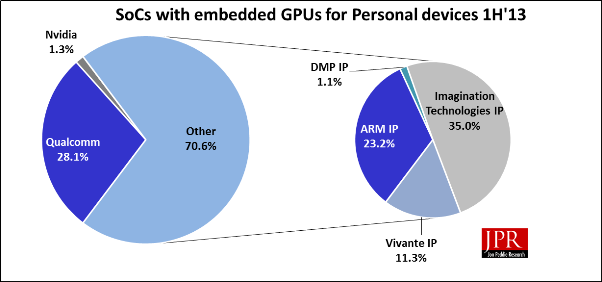
But then again, if you don't like those figures, try these ones.

http://jonpeddie.com/press-releases...tary-gpu-supplier-imagination-technologies-t/
mobile%20rev%204.png


Table%20rev4.JPG


It looks like they can't make up their mind if vivante got 9.8 or 11.3 %, amongst other things.

I'm sure one of those pages will get corrected eventually.

Anyhow, 9.8% or 11.3%. How is vivante getting 10% share of the gpu market, up from 0.3% the previous year. The only significant user of vivante IP in the mobile space I can think of is Huawei via the Hisilicon K3V2 soc. But really, they as much as 1/2 of Mali's shipments ?

I know that their 2d composition engine in is Omap4470, which shipped in a lot of tablets (not least kindle HDs), but for every one of them, there was an IMG GPU too.

Anyone got an big source of vivante shipments they can think of ?
 
Last edited by a moderator:
That's pretty stunning growth for Vivante. Also, I'd never heard of DMP before. What kind of graphics IP do they make?
 
i guess theyre trying to point out how successful qualcomm has been, in particular how competitive adreno is vs the many others licensing their gpu tech.

anyway i agree, they (jpr) definitely could have managed with a single graph.
 
Is it just me, or are those pie charts drawn in an incredibly misleading way?

They definitely are.

For whatever reason, nVidia which is one of the vendors with lower absolute marketshare, appears in the "big" pie, whereas other vendors with 15x larger marketshare are put aside in the "others" pie.

Quite a biased way of displaying results, IMO.

Vivante appears in a lot of chinese devices, as said before. Not only in the custom Huawei and "Actions" SoC but also in SoCs from Freescale, Marvell and some older Rockchips SoCs.

But my guess is that a large piece of that Vivante marketshare is coming from the dedicated 2D GPU GC320 in OMAP4470, which appeared in Kindle Fire 8.9", Nook Tablet HD and all Archos flagships.
So it's possible that part of the Vivante marketshare actually belongs to IMG if we were to count 3D GPUs.
 
They definitely are.

For whatever reason, nVidia which is one of the vendors with lower absolute marketshare, appears in the "big" pie, whereas other vendors with 15x larger marketshare are put aside in the "others" pie.

Quite a biased way of displaying results, IMO.
Clear to me that the pie chart is grouping and breaking out suppliers of IP separately from the main chart which is all IP (i.e. including those that only supply themselves).

Yes Nvidia is NOW in the other bracket, but not in the timeframe of the pie chart.

Vivante appears in a lot of chinese devices, as said before. Not only in the custom Huawei and "Actions" SoC but also in SoCs from Freescale, Marvell and some older Rockchips SoCs.

But my guess is that a large piece of that Vivante marketshare is coming from the dedicated 2D GPU GC320 in OMAP4470, which appeared in Kindle Fire 8.9", Nook Tablet HD and all Archos flagships.
So it's possible that part of the Vivante marketshare actually belongs to IMG if we were to count 3D GPUs.

I can't see the logic of counting a relatively small 2D GPU IP for vivante and not counting the 3D GPU in the same soc for IMG. I'd hope that paying $2500-$5000 for a report, it might have some basic accuracies. Mind you, with both the above quite different charts appearing in headline articles on the JPR website, who knows.
 
Clear to me that the pie chart is grouping and breaking out suppliers of IP separately from the main chart which is all IP (i.e. including those that only supply themselves).

Yes Nvidia is NOW in the other bracket, but not in the timeframe of the pie chart.

You're right, I didn't see that distinction had been made.


I can't see the logic of counting a relatively small 2D GPU IP for vivante and not counting the 3D GPU in the same soc for IMG. I'd hope that paying $2500-$5000 for a report, it might have some basic accuracies. Mind you, with both the above quite different charts appearing in headline articles on the JPR website, who knows.

Then again, Samsung doesn't even appear in their list of SoC suppliers (see the table of contents in at the bottom), which is pretty shocking IMO.
Unless they put Samsung along with the "chinese manufacturers", which would be equally shocking for their ignorance.
 
I emailed JPR today about the pie-charts. I didn't get a reply, but the two pages now show the same pie-charts, although they didn't taken down the other pie-chart which is why it can still be seen in the 1st post :)

The two pages still show different tables, one shows '11 & '12 columns, the other showing '12 and '13 columns (both show the same data). And its not only the columns, the narrative refers to 2011 or 2012 depending on which page.
It talks about dramatic changes are expected during the next 12 months, and then cites amongst other things the introduction of the ipad mini, and TI supplying chips to Amazon The remarks would be consistent with the state of play a year ago.

Charging $5000 for the full report, I'm not impressed with the teaser.
 
Last edited by a moderator:
Back
Top