A1xLLcqAgt0qc2RyMz0y
Veteran
Cases in Texas are exploding.
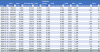
Total cases through May 31st was only 64,287, Total cases for the month of June was: 94,223
The month of June alone was 146.6% more than all the cases before June 1st.
Last seven day's case increases are 10,158, 14,916, 10,291, 7,307, 10,745, 5,655, 8,196
First day that cases exceeded 2000 was June 10th.
First day that cases exceeded 3000 was June 17th.
First day that cases exceeded 4000 was June 20th.
First day that cases exceeded 5000 was June 23th.
First day that cases exceeded 6000 was June 30th.
First day that cases exceeded 7000, 8000 was July 1st.
First day that cases exceeded 9000, 10000 was July 7th.
First day that cases exceeded 11000,12000, 13000, 14000 was July 17th.
The numbers of cases in Texas for each week since June 1, 2020 are :
June 1-7 : Total Cases 10,691 - Average of 1,527 per day
June 8-14 : Total Cases 12,876 - Average of 1,839 per day - 20% higher than the previous week
June 15-21 : Total Cases 22,271 - Average of 3,182 per day - 73% higher than the previous week
June 22-28 : Total Cases 37,127 - Average of 5,304 per day - 67% higher than the previous week
June 29-July 5 : Total Cases 46,511 - Average of 6,644 per day - 25% higher than the previous week
July 6-12: Total Cases 63,419 - Average of 9,060 per day - 36% higher than the previous week
July 13-18: Total Cases 59,072 - Average of 9,845 per day - 9% higher than the previous week - only six days for the week so far