Dont you know everything's bigger in Texasbut texas is so much higher.
iroboto
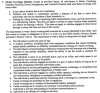
https://coronavirus.jhu.edu/map.html
https://coronavirus.jhu.edu/data/state-timeline/new-confirmed-cases/texas
Dont you know everything's bigger in Texasbut texas is so much higher.
is there no way to get a csv or zip of the actual data? nvm , found itDont you know everything's bigger in Texas
iroboto
https://coronavirus.jhu.edu/map.html
https://coronavirus.jhu.edu/data/state-timeline/new-confirmed-cases/texas


Date; Total Tests; New Tests; Tests per 1M Population; Total Cases; Cuyahoga County Cases; Hospitalizations; Total Deaths; New Cases; New Hospitalizations; New Deaths
2020-06-14;    543,260;    7,317;    46,476;    41,148;    5,175;    6,895;    2,557;    300;    31;    3
2020-06-15;    554,128;    10,868;    47,406;    41,576;    5,220;    6,948;    2,573;    428;    53;    16
2020-06-16;    565,034;    10,906;    48,339;    42,010;    5,271;    7,007;    2,597;    434;    59;    24
2020-06-17;    581,444;    16,410;    49,743;    42,422;    5,336;    7,051;    2,611;    412;    44;    14
2020-06-18;    596,875;    15,431;    51,063;    43,122;    5,404;    7,104;    2,633;    700;    53;    22
2020-06-19;    612,854;    15,979;    52,430;    43,731;    5,481;    7,167;    2,667;    609;    63;    34
2020-06-20;    626,765;    13,911;    53,620;    44,262;    5,555;    7,201;    2,697;    531;    34;    30
2020-06-21;    639,991;    13,226;    54,752;    44,808;    5,633;    7,242;    2,700;    546;    41;    3
2020-06-22;    656,318;    16,327;    56,148;    45,537;    5,734;    7,292;    2,704;    729;    50;    4
2020-06-23;    667,077;    10,759;    57,069;    46,127;    5,820;    7,379;    2,735;    590;    87;    31
2020-06-24;    680,687;    13,610;    58,233;    46,759;    5,964;    7,447;    2,755;    632;    68;    20
2020-06-25;    696,200;    15,513;    59,560;    47,651;    6,111;    7,502;    2,772;    892;    55;    17
2020-06-26;    718,086;    21,886;    61,433;    48,638;    6,287;    7,570;    2,788;    987;    68;    16
2020-06-27;    741,353;    23,267;    63,423;    49,455;    6,429;    7,624;    2,804;    817;    54;    16
2020-06-28;    753,246;    11,893;    64,441;    50,309;    6,571;    7,681;    2,807;    854;    57;    3
2020-06-29;    770,860;    17,614;    65,947;    51,046;    6,694;    7,746;    2,818;    737;    65;    11
2020-06-30;    784,362;    13,502;    67,103;    51,789;    6,831;    7,839;    2,863;    743;    93;    45
2020-07-01;    788,403;    4,041;    67,448;    52,865;    7,013;    7,911;    2,876;    1,076;    72;    13
2020-07-02*;    789,704;    1,301;    67,560;    54,166;    7,013;    8,038;    2,886;    1,301;    127;    10
2020-07-03*;    824,481;    34,777;    70,535; 55,257;    7,392;    8,084;    2,903;    1,091;    46;    17
2020-07-04;    844,675;    20,194;    72,262;    56,183;    7,571;    8,111;    2,907;    926;    27;    4
2020-07-05;    865,069;    20,394;    74,007;    57,151;    7,724;    8,172;    2,911;    968;    61;    4
2020-07-06;    877,688;    12,619;    75,087;    57,956;    7,883;    8,249;    2,927;    805;    77;    16
2020-07-07;    892,731;    15,043;    76,374;    58,904;    8,048;    8,383;    2,970;    948;    134;    43
2020-07-08; 911,905; 19,174; 78,014; 60,181; 8,277; 8,489; 2,991; 1,277; 106; 21Where do you get your numbers from? Can I just source them for my own notebooks, I'll just showcase some interesting metrics since Texas seems worthy of doing some deep diving.
DALLAS -- As of 11:00am July 8, 2020, Dallas County Health and Human Services is reporting 1,029 additional positive cases of 2019 novel coronavirus (COVID-19), bringing the total case count in Dallas County to 29,160, including 426 deaths.
The additional 16 deaths being reported today include:
A woman in her 20’s who was a resident of the City of Grand Prairie. She had been critically ill in an area hospital, and did not have underlying high risk health conditions.
A man in his 40’s who was a resident of the City of Grand Prairie. He had been cr itically ill in an area hospital, and did not have underlying high risk health conditions.
A woman in her 40’s who was a resident of the City of Farmers Branch. She had been hospitalized, and had underlying high risk health conditions.
A man in his 50’s who was a resident of the City of Garland. He had been critically ill in an area hospital, and had underlying high risk health conditions.
A woman in her 50’s who was a resident of a long-term care facility in the City of Dallas. She expired in the facility, and had underlying high risk health conditions.
A woman in her 50’s who was a resident of the City of Grand Prairie. She had been critically ill in an area hospital, and had underlying high risk health conditions.
A man in his 60’s who was a resident of the City of Dallas. He had been hospitalized, and had underlying high risk health conditions.
A woman in her 60’s who was a resident of the City of Coppell. She expired in area hospital ED, and did not have underlying high risk health conditions.
A woman in her 60’s who was a resident of the City of Grand Prairie. She had been critically ill in an area hospital, and had underlying high risk health conditions.
A woman in her 70’s who was a resident of the City of Dallas. She had been hospitalized, and had underlying high risk health conditions.
A woman in her 70’s who was a resident of the City of Grand Prairie. She had been critically ill in an area hospital, and had underlying high risk health conditions.
A man in his 70’s who was a resident of the City of Dallas. He had been critically ill in an area hospital, and had underlying high risk health conditions.
A woman in her 70’s who was a resident of the City of Dallas. She had been hospitalized, and had underlying high risk health conditions.
A man in his 80’s who was a resident of a long-term care facility in the City of Dallas. He expired in the facility, and had underlying high risk health conditions.
A woman in her 80’s who was a resident of a long-term care facility in the City of Mesquite. She had been hospitalized, and had underlying high risk health conditions.
A woman in her 80’s who was a resident of the City of Garland. She had been hospitalized, and had underlying high risk health conditions.
An increasing proportion of COVID-19 cases in Dallas County are being diagnosed in young adults between 18 to 39 years of age, such that of all cases reported after June 1st, half have been in this age group. Increasing reports of cases are continuing to be associated with multiple large recreational and social gatherings since the beginning of June, including house parties. Of the cases requiring hospitalization to date, more than two-thirds have been under 65 years of age. Diabetes has been an underlying high-risk health condition reported in about a third of all hospitalized patients with COVID-19.
The percentage of respiratory specimens testing positive for SARS-CoV-2 increased to 32% among symptomatic patients presenting to area hospitals in week 26. The age-adjusted rates of confirmed COVID-19 cases in non-hospitalized patients have been highest among Hispanics (667.4 per 100,000), Asians (187.4 per 100,000) and Blacks (136.4 per 100,000). These rates have been higher than Whites (43.8 per 100,000). Over 60% of overall COVID-19 cases to date have been Hispanic. Of cases requiring hospitalization who reported employment, over 80% have been critical infrastructure workers, with a broad range of affected
occupational sectors, including: healthcare, transportation, food and agriculture, public works, finance, communications, clergy, first responders and other essential functions.
Of the 426 total deaths reported to date, about a third have been associated with long-term care facilities.

")
What a horrible and totally unavoidable tragedy! If only there would have been some way they could have protected themselves somehow! We need to allow guns back in to the Capitol buildings until this outbreak is over!26 Mississippi Lawmakers Test Positive for Coronavirus in Outbreak Connected to Capitol
https://www.msn.com/en-us/news/us/2...-in-outbreak-connected-to-capitol/ar-BB16xCMP
https://www.msn.com/en-us/news/us/2...-in-outbreak-connected-to-capitol/ar-BB16xCMP
State Health Officer Thomas Dobbs told The Mississippi Clarion-Ledger that the number of COVID-19 cases linked to the Capitol outbreak has grown to 36, including 26 lawmakers.
The leaders of both chambers, Speaker Philip Gunn and Lt. Gov. Delbert Hosemann, both Republicans, are among the politicians who have tested positive after legislators flouted recommendations to wear face coverings while inside the Capitol building.
Well, if the UK numbers I linked to are correct, they might not be. The economic health of normal operation may be better for the nation in the long run than saving the lives of hundreds of thousands of old and sick people. We won't really know until a few years from now which countries/states came out on top and with which policies.Sorry, I'm just truly starting to stop feeling bad for the stupid and hating them. They're literally killing my country!
As of 11:00 am July 9, 2020, Dallas County Health and Human Services is reporting 1,201 additional positive cases of 2019 novel coronavirus (COVID-19), bringing the total case count in Dallas County to 30,361, including 436 deaths.
The additional 10 deaths being reported today include:
An increasing proportion of COVID-19 cases in Dallas County are being diagnosed in young adults between 18 to 39 years of age, such that of all cases reported after June 1st, half have been in this age group. Increasing reports of cases are continuing to be associated with multiple large recreational and social gatherings since the beginning of June, including house parties. Of the cases requiring hospitalization to date, more than two-thirds have been under 65 years of age.
- A man in his 50’s who was a resident of a long-term care facility in the City of Garland. He had been critically ill in an area hospital, and had underlying high risk health conditions.
- A woman in her 60’s who was a resident of the City of Dallas. She had been hospitalized, and had underlying high risk health conditions.
- A man in his 60’s who was a resident of the City of Dallas. He had been critically ill in an area hospital, and had underlying high risk health conditions.
- A man in his 60’s who was a resident of the City of Irving. He had been critically ill in an area hospital, and had underlying high risk health conditions.
- A woman in her 60’s who was a resident of the City of Sunnyvale. She had been critically ill in an area hospital, and had underlying high risk health conditions.
- A woman in her 70’s who was a resident of the City of Dallas. She had been critically ill in an area hospital, and had underlying high risk health conditions.
- A man in his 70’s who was a resident of the City of Garland. He had been critically ill in an area hospital, and had underlying high risk health conditions.
- A woman in her 70’s who was a resident of the City of Dallas. She expired in an area hospital ED, and had underlying high risk health conditions.
- A man in his 70’s who was a resident of the City of Dallas. He had been critically ill in an area hospital, and had underlying high risk health conditions.
- A man in his 90’s who was a resident of a long-term care facility in the City of Dallas. He expired in the facility, and had underlying high risk health conditions.
Diabetes has been an underlying high-risk health condition reported in about a third of all hospitalized patients with COVID-19. The percentage of respiratory specimens testing positive for SARS-CoV-2 increased to 32% among symptomatic patients presenting to area hospitals in week 26. The age-adjusted rates of confirmed COVID-19 cases in non-hospitalized patients have been highest among Hispanics (667.4 per 100,000), Asians (187.4 per 100,000) and Blacks (136.4 per 100,000). These rates have been higher than Whites (43.8 per 100,000). Over 60% of overall COVID-19 cases to date have been Hispanic.
Of cases requiring hospitalization who reported employment, over 80% have been critical infrastructure workers, with a broad range of affected occupational sectors, including: healthcare, transportation, food and agriculture, public works, finance, communications, clergy, first responders and other essential functions.
Of the 436 total deaths reported to date, about a third have been associated with long-term care facilities.