Coronavirus Pandemic (COVID-19) (SARS-CoV-2) [2020]

Not sure if this is faster for people to glean information.
EcWszUQXYAQQvmm

Please provide the link to this page.
 
I found the results of UK testing and they suggest the disease is less impactful than the numbers we've been seeing for months.

Of those individuals providing blood samples, 6.3% tested positive for antibodies to COVID-19 (95% confidence interval: 4.7% to 8.1%); this equates to 1 in 16 people or 2.8 million people in England.
Therefore, the pieces of the puzzle:
  • 246,000 confirmed cases in England
  • 128,00 hospital admissions across UK, so less in just England.
  • 40,000 deaths in England.
  • From 3 million infected that's something like 10% showing up as positive cases, 4% being hospitalised and 1% fatality.
That's way, way lower than the 5-15% death rates coming from confirmed cases, and shows the disease has been very widespread with largely low to zero symptoms. We're looking at a 1:9 ratio of tested cases versus true cases, and 90% of infected aren't even aware they have it.

If so, the interpretation and advice from the WHO was completely wrong. They were looking at only the tip of the iceberg above water that they could see and failed to appreciate the rest of it under water, out of sight where it wasn't doing anything, passing harmlessly from person to person. Early suggestions were asymptomatic spreaders were a tiny minority. That appears to be complete fiction and I wonder what it was based on?

The economic impact of that 1%, especially if localised to the 65+ age range, certainly changes the discussion around lockdowns.

upload_2020-7-8_13-3-26.png

Edit: 16% of England's population is 65 and over, so that 1% comes from only 16% of the population. Looks like 80% of the population is largely untouched. And that's heavily skewed to older ages.
 
Last edited:
It seems the Governor finally mandated mask wearing. https://coronavirus.ohio.gov/wps/po...face-coverings-required-in-high-risk-counties

COVID-19 Update: Face Coverings to be Required in High-Risk Counties

Ohio Governor Mike DeWine announced today that effective on Wednesday, July 8, 2020, at 6:00 p.m., a new Ohio Department of Health order will mandate face coverings in public in all counties that are designated as a Red Alert Level 3 Public Health Emergency or a Purple Alert Level 4 Public Health Emergency.

Currently, seven counties in Ohio are designated at Red Alert Level 3 which indicates that those in these counties have a very high risk of exposure and spread:
  • Butler County
  • Cuyahoga County
  • Franklin County
  • Hamilton County
  • Huron County
  • Montgomery County
  • Trumbull County
As of today, no counties have reached Purple Alert Level 4, however, Franklin County is approaching this top tier.

"In addition to social distancing and reducing unnecessary interactions with others, we know that wearing a mask helps protect others in the community. It has been, and remains, a very strong recommendation that I urge all Ohioans to continue doing even if you are not in a red-alert county," said Governor DeWine. "In red-alert and purple-alert counties, however, we must do more to help protect citizens because the risk of spread is increasing even more."

Last week, Governor DeWine announced the creation of Ohio's Public Health Advisory System, which consists of four alert levels that provide Ohioans with guidance as to the severity of COVID-19 spread in the counties in which they live. Each level is calculated based on seven data-driven health indicators.

Those in counties designated as Red Alert Level 3 or Purple Alert Level 4 are required to wear a face covering:
  • In any indoor location that is not a residence;
  • When outdoors and unable to consistently maintain a distance of six feet or more from individuals who are not members of their household; or
  • While waiting for, riding, driving, or operating public transportation, a taxi, a private car service, or a ride-sharing vehicle.
The order does not apply to children under the age of 10 or any other minor who cannot safely wear a face covering. The order also reflects the mask guidance in place for employees and businesses which does not require a person to wear a mask if their physician advises against it, if wearing a mask is prohibited by federal regulation, if communicating with the hearing impaired, when alone in an office or personal workspace, and other similar measures.

Schools that offer Kindergarten through Grade 12 instruction should follow the guidelines set forth last week by the Ohio Department of Education and the Ohio Department of Health.

The Ohio Department of Health will update county rankings every Thursday. Any county that increases to Red Alert Level 3 will automatically be included in the face-covering mandate. Any county that decreases from Red Alert Level 3 to Orange Alert Level 2 will automatically be released from the face-covering requirement.
 
I found the results of UK testing and they suggest the disease is less impactful than the numbers we've been seeing for months.

Of those individuals providing blood samples, 6.3% tested positive for antibodies to COVID-19 (95% confidence interval: 4.7% to 8.1%); this equates to 1 in 16 people or 2.8 million people in England.
Therefore, the pieces of the puzzle:
  • 246,000 confirmed cases in England
  • 128,00 hospital admissions across UK, so less in just England.
  • 40,000 deaths in England.
  • From 3 million infected that's something like 10% showing up as positive cases, 4% being hospitalised and 1% fatality.
That's way, way lower than the 5-15% death rates coming from confirmed cases, and shows the disease has been very widespread with largely low to zero symptoms. We're looking at a 1:9 ratio of tested cases versus true cases, and 90% of infected aren't even aware they have it.

If so, the interpretation and advice from the WHO was completely wrong. They were looking at only the tip of the iceberg above water that they could see and failed to appreciate the rest of it under water, out of sight where it wasn't doing anything, passing harmlessly from person to person. Early suggestions were asymptomatic spreaders were a tiny minority. That appears to be complete fiction and I wonder what it was based on?

The economic impact of that 1%, especially if localised to the 65+ age range, certainly changes the discussion around lockdowns.

View attachment 4253

Edit: 16% of England's population is 65 and over, so that 1% comes from only 16% of the population. Looks like 80% of the population is largely untouched. And that's heavily skewed to older ages.
Which numbers are you using btw?
for worldwide I just type COVID into google. Switch the setting to statistics on the bar and switch to Worldwide. And when you work out fatality rate it’s 4.6%

but yea, UK is 1.55% fatality rate.

and I think that’s fine. I think that’s a sign of a healthy successful medical system.
When you look at Brazil and India, and I suspect soon parts of the US where if you don’t have ICU beds and can’t be treated, the fatality rates start going up.

i think looking at the runaway potential here is the greatest fear. As long as you can keep the virus in manageable numbers, medicine works and controlling fatality rate. It’s really when the numbers get out of hand. Even young people will start dying in higher numbers. Because there won’t be beds to treat. The resources aren’t there
 
Last edited:
Which numbers are you using btw?
for worldwide I just type COVID into google. Switch the setting to statistics on the bar and switch to Worldwide. And when you work out fatality rate it’s 4.6%

The fatality rate is a lot lower since infected but undiagnosed are not counted.
 
Last edited:
The fatality rate is a lot lower since a lot of infected but undiagnosed are not counted.
Not in random testing type scenarios. Positivity rate should help you get an idea of the type of real spread your in across the area.
So if you’re sampling across say Texas and the positivity rate is say 10% for a population, enough of those samples and you have an idea. Since they are walking around, it’s clear they are asymptotic, at least for now.

I believe earlier this was a problem in our initial run, only those that were sick were tested, but I believe they have been doing all sorts of roadside testing etc now. Sampling was really low as well. Sampling continues to rise and increase now.

And even if that’s not the case, sampling over an extremely long period of time, would showcase that effect. It would showcase fatality rates dropping because we would sample more and more asymptotic cases over time.
 
Which numbers are you using btw?
The detailed numbers from the Office of National Statistics

Dashboard is here: https://coronavirus-staging.data.gov.uk/

Report is already linked. Lots here: https://www.ons.gov.uk/peoplepopula...onditionsanddiseases/datalist?filter=datasets

You can basically search anything on Google for Stats in the UK and get ONS reports.

And when you work out fatality rate it’s 4.6%
It's not though. The asymptomatic spread of this disease is far higher than people ever knew. It's basically a fast spreader, not a slow spreader as first described. High speed propagation, low impact. We didn't know that until we had sufficient testing. Now we have hundreds of thousands of antibody tests, we see that the spread was rapid. It was the fact it spread so fast that overwhelmed the medical resources and we heard about dozens of younger people in hospital. But those young people were the outliers, a tiny fraction who are susceptible. At the same time, their peers were getting the disease without even knowing it.

Right now, there are 9x as many people in Brazil with Covid19 who aren't registered who don't even know they've got the disease.

The old suggestion was 80% were mild to no symptoms, 15% were severe, and 5% were critical. The UK numbers show from 3 million people, 128,000 were hospitalised. That's 4%, not 20%.

96% are mild to no symptoms.
4% need treatment. .
1% need ventilators, of which 80% are the over 65s. And in the under 65s, it's those with underlying health conditions.

Younger, healthy people are basically immune to its effects.

i think looking at the runaway potential here is the greatest fear. As long as you can keep the virus in manageable numbers, everyone medicine works. It’s really when the numbers get out of hand. Even young people will start dying in higher numbers. Because there won’t be beds to treat. The resources aren’t there
The number of young folk with problems is actually tiny. There have been about 4000 deaths in under 65s in UK, from 3 million people. They are a small percentage of the small percentage of people who suffer from Covid19.

Prior to the antibody testing, we only had the viral presence tests, and there we got figures like 15% mortality and a notable percentage of younger sufferers. But the actual disease was 10x more widespread than that! Every number is an order of magnitude less severe.

At this point, it looks to me like SARS-Cov2 is just another cold germ. It's new so it'll knock out the weaker population, but the rest will have it, recover, and be able to fend it off like other coronaviruses. It'll just become another part of the invisible micro-fauna we encounter harmlessly every day. I think we got hoodwinked by misinformation because we couldn't get the right data and could only base decisions on the wrong data.
 
The detailed numbers from the Office of National Statistics

Dashboard is here: https://coronavirus-staging.data.gov.uk/

Report is already linked. Lots here: https://www.ons.gov.uk/peoplepopula...onditionsanddiseases/datalist?filter=datasets

You can basically search anything on Google for Stats in the UK and get ONS reports.

It's not though. The asymptomatic spread of this disease is far higher than people ever knew. It's basically a fast spreader, not a slow spreader as first described. High speed propagation, low impact. We didn't know that until we had sufficient testing. Now we have hundreds of thousands of antibody tests, we see that the spread was rapid. It was the fact it spread so fast that overwhelmed the medical resources and we heard about dozens of younger people in hospital. But those young people were the outliers, a tiny fraction who are susceptible. At the same time, their peers were getting the disease without even knowing it.

Right now, there are 9x as many people in Brazil with Covid19 who aren't registered who don't even know they've got the disease.

The old suggestion was 80% were mild to no symptoms, 15% were severe, and 5% were critical. The UK numbers show from 3 million people, 128,000 were hospitalised. That's 4%, not 20%.

96% are mild to no symptoms.
4% need treatment. .
1% need ventilators, of which 80% are the over 65s. And in the under 65s, it's those with underlying health conditions.

Younger, healthy people are basically immune to its effects.

The number of young folk with problems is actually tiny. There have been about 4000 deaths in under 65s in UK, from 3 million people. They are a small percentage of the small percentage of people who suffer from Covid19.

Prior to the antibody testing, we only had the viral presence tests, and there we got figures like 15% mortality and a notable percentage of younger sufferers. But the actual disease was 10x more widespread than that! Every number is an order of magnitude less severe.

At this point, it looks to me like SARS-Cov2 is just another cold germ. It's new so it'll knock out the weaker population, but the rest will have it, recover, and be able to fend it off like other coronaviruses. It'll just become another part of the invisible micro-fauna we encounter harmlessly every day. I think we got hoodwinked by misinformation because we couldn't get the right data and could only base decisions on the wrong data.
I don't think there has been enough sampling to showcase your point (is just another cold germ). the study is skewed because we performed a global lockdown. All of our standard influenza (all the influenzas combined) kill typically 650K per year. CV-19 is already at 544K and those are with largely social distancing measures and lockdown mechanisms in place. Where influenza goes unchecked globally each year and only kills 650k. CV-19 has already killed 544K in half the time, with social distances, sanitization, and global lockdown mechanisms.

Statistically if your statement was true, CV-19 on a simple 2-sample test you'd see it match how quickly flu kills. And that's just not true. At this rate, when we open up, which is happening now, it's likely at least double the flu.

I don't have a problem looking at a couple of statements saying we've probably misjudged the danger of CV. But we do that from a place of safety, the safety of the protocols that were put in place. Even countries that decided not to (sweden) suffered a great deal of death, the population had the discipline to engage in non mandatory social distancing rules.

Tokyo has also needed to open and close their rules as well. And each country is desperate to keep the number of infections slow and low.

Slow and low appears to work.

Fast and hot is likely bad. And i think in the next 30 days or so, we will know the outcome of fast and hot when Florida and Texas are done.

I'm not saying you're wrong, but the overall data as I see it currently, doesn't suggest that's true. If cv-19 is somehow run rampant like the flu asymptotically, it's already several times more deadly considering how hard the world is trying to constrain it. There are still 6 months left.
 
There's a strand in this thread that is giving me déjà vu about the Y2K bug. Man, looking back on how things turned out on 2000-01-02 we sure over-reacted to that, and all of the time, effort, money and worrying was unnecessary. Or something.

I just hope we make the same mistake again next time.
 
Don't worry, this won't be like Y2K. Y2K results were over within a day.

This is going to be a seriously long and slow burn. Everyday for the next 2 years or longer people will debate the actions taken in hindsight. Which is the right thing to do, to see what you can do for next time. But it's going to take a lot of time for those final results to roll in.

the last coronavirus that went global (SARS) was already dead by about now. 6 months. We are currently month 6-7? No signs of killing this virus off in less than a month.
 
If deaths are 2-3-4 weeks behind the daily cases the shit is going to be hitting fan again in USA. Stock market is super high, time to prepare sell strategy in case things escalate again.

Daily cases
upload_2020-7-8_7-21-34.png

Deaths yesterday seem to start following daily cases graph from maybe 2-3 weeks ago.
upload_2020-7-8_7-23-14.png
 
I don't think there has been enough sampling to showcase your point (is just another cold germ). the study is skewed because we performed a global lockdown.
I don't think that makes a difference in terms of who's affected. We have a saturation point where we don't take people in to hospital and above that, we can't count hospitalisations and a higher proportion will die from lack of treatment. However, we didn't hit that in the UK. Everyone needing to go to hospital was crammed in and counted. Hence these figures, 128,000 hospitalisations out of 3,000,000 SARS-Cov2 infected (I guess we can't count them as Covid19 as that's the name of the disease and they didn't express the disease), must be representative.

The disease only affects 4% of the population, not 20%, no? How is that figure wrong?
It may not be. That part needs further investigation.

I think we look at Sweden for example, who chose to ignore everything. Deaths per 1 million people surpassed Italy and the US. It wasn't until they enacted stricter social distancing measures they did finally manage to bring it all the way down (they were above 100 deaths per day at peak IIRC).

And we're seeing something like that happen with unchecked Texas and Florida again. they are at 60 deaths a day now? Deaths lag behind cases, so we'll know soon enough.

I can't tell you that you're wrong, the numbers suggest your summary. But that's just 1 piece of a larger puzzle, we don't know what information is missing as to why some countries fair better than others.

The only thing that seems to be universal, is the social distancing measures and lockdowns work, and seem to work very well. outside of that, we need an audit or just a lot more sampling data.

We seem to be waiting on whether or not herd immunity exists. I can only look at stats, I'm not virologist or anything, the subject matter is way out of my domain knowledge. Which means I cannot generate any useful evaluations of the data. But I understand sampling and sampling methods.
 
Some representative from the state of Ohio claimed wearing a face mask depletes your oxygen levels to dangerous levels within seconds
Thunderf00t did a video debunking him and it got deleted by youtube for terms of service violations - wonderful
 
Not sure if this is faster for people to glean information.
EcWszUQXYAQQvmm

This is nice for an overview but I will continue with my posts for both Dallas County (where I live) and Texas as a whole mainly because Texas has been shown to obscure what is really happening.

Example Texas tried to inflate testing numbers where they mixed Antibody tests (useless) in Total Tests without stating that they were. They got caught and as of now they continue to add Antibody tests in the "Total Tests" number which is falsely inflating the "Total Test" number. As of yesterday: Only 89.9% of Total Tests are Viral Tests the other 10.1% of tests are the useless Antibody Tests

Also Texas is reporting this false "Total Test" number to "Worldometer" coronavirus site to make Texas look better in testing than they really are.

Example: Texas claims that total tests per 1M population are 85,220 which places Texas as the 11th worst State but they really are: Total Viral Tests for Texas is 2,221,287 which works out to be 76,607 per 1M population so Texas is really the 8th worst state in testing

Texas has been manipulating numbers since they started to open the state in early May to justify the re-opening and to do more re-openings since while ignoring science. Because of this I expand their numbers to show more details. My first report shows and corrects the "Total Test" number and the real place in the Worldometer in testing as Texas is still reporting that wrong.

My second report is showing the weekly case explosion since June 1st. The 7-day average in Daily New Cases is very hard to read in the above website so I will continue with my report that shows when "first day cases exceed" dates:

First day that cases exceeded 2000 was June 10th.
First day that cases exceeded 3000 was June 17th.
First day that cases exceeded 4000 was June 20th.
First day that cases exceeded 5000 was June 23th.
First day that cases exceeded 6000 was June 30th.
First day that cases exceeded 7000 was July 1st.
First day that cases exceeded 8000 was July 1st.
First day that cases exceeded 9000 was July 7th.
First day that cases exceeded 10000 was July 7th.


since that gives more feel to the gravity of the situation here in Texas.

Also the weekly case averages changes are an eye opener:

The numbers of cases in Texas for each week since June 1, 2020 are :

June 1-7 : Total Cases 10,691 - Average of 1,527 per day
June 8-14 : Total Cases 12,876 - Average of 1,839 per day - 20% higher than the previous week
June 15-21 : Total Cases 22,271 - Average of 3,182 per day - 73% higher than the previous week
June 22-28 : Total Cases 37,127 - Average of 5,304 per day - 67% higher than the previous week
June 29-July 5 : Total Cases 46,511 - Average of 6,644 per day - 25% higher than the previous week
July 6-7 : Total Cases 15,346 - Average of 7,673 per day - 15% higher than the previous week - Only two days for the week so far
 
Last edited:
It may not be. That part needs further investigation.

I think we look at Sweden for example, who chose to ignore everything. Deaths per 1 million people surpassed Italy and the US. It wasn't until they enacted stricter social distancing measures they did finally manage to bring it all the way down (they were above 100 deaths per day at peak IIRC).
The death rate doesn't tell us anything without a true infection rate.

And we're seeing something like that happen with unchecked Texas and Florida again. they are at 60 deaths a day now? Deaths lag behind cases, so we'll know soon enough.
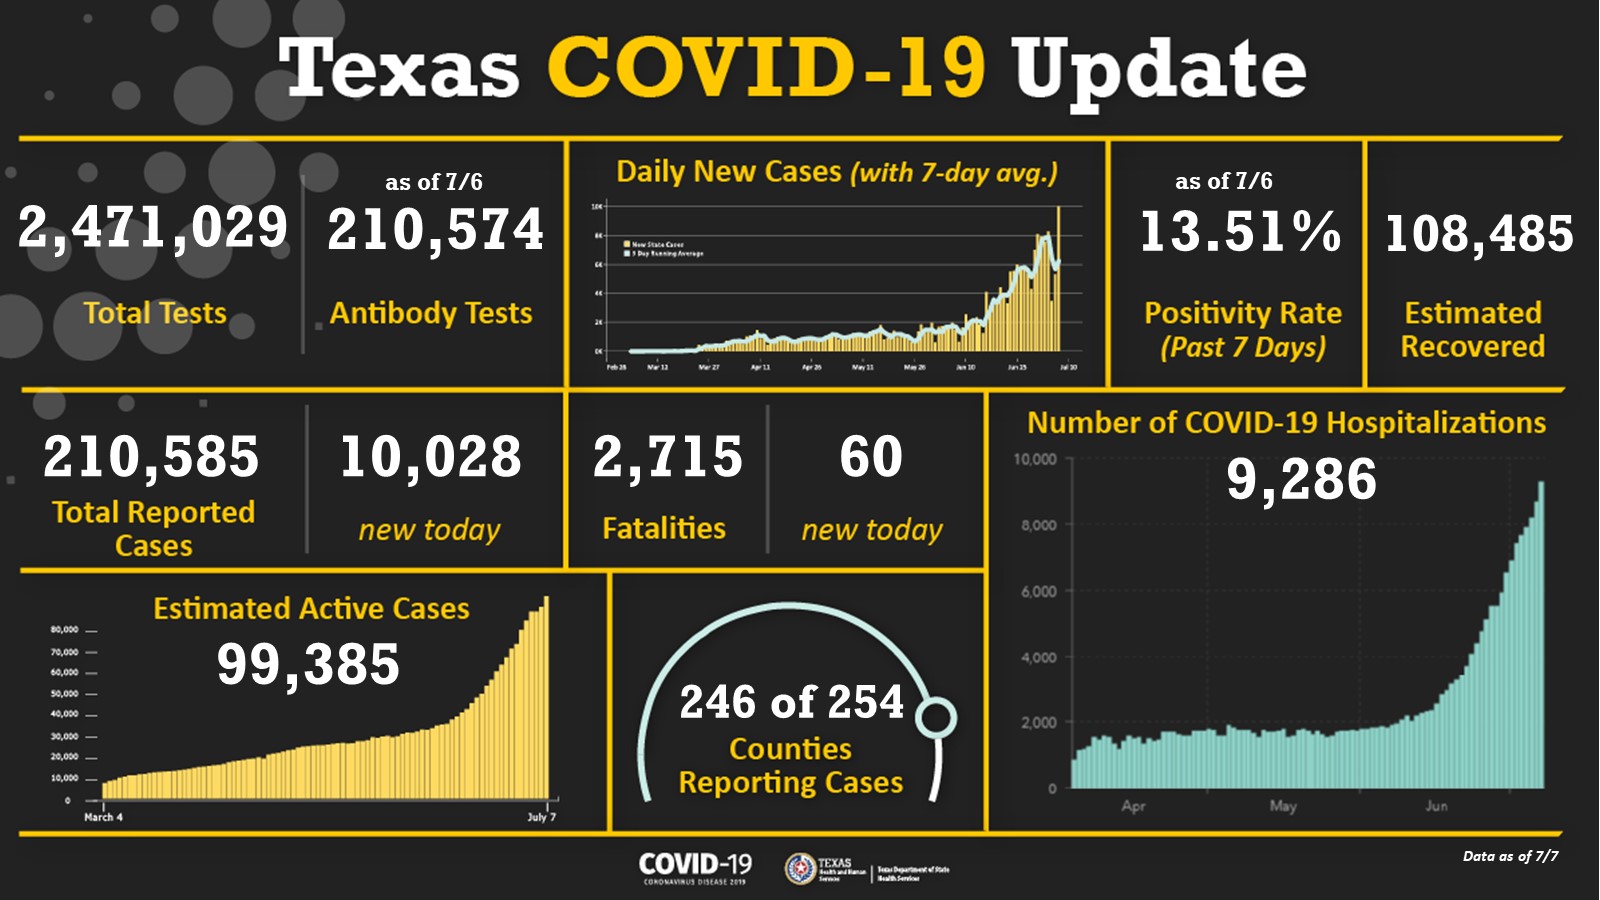
Let's say there's a virus that kills 2% of people and spreads very slowly, so over 5 years it hits everyone in a 10,000,000 population country and kills 200,000. That's ~100 people a day.

Then you have another virus that kills only 0.2% of people but spreads very quickly, so in 100 days it hits everyone in a 10,000,000 population country and kills 20,000. That's 200 people a day. Then given the ramping of the cases, it'd bunch all those deaths up, so it'd hit high peak numbers but in reality not do a lot of damage. It'd just be very front-loaded.

Looking at deaths per day doesn't tell you whether those deaths are front loaded or not.

I can't tell you that you're wrong, the numbers suggest your summary. But that's just 1 piece of a larger puzzle, we don't know what information is missing as to why some countries fair better than others.
The missing number is actual infection rate. All counting to date has been people going to medical services with symptoms to be tested, or medical staff, etc. associated with known cases. Some 10% of them or whatever are positive. Outside of that number is the people not being tested because there's nothing wrong with them. Antibody testing finally let's us catch up with how many people have had C19 and fills in the missing total infection rate.

The changing positivity rate shows increasing or decreasing rate of infection, but not the number of people being infected because we don't have a baseline. Let's say a State performs 1000 tests a day and finds 100 +ves for a week, The next week, they find 150 +ve, and then 200 +ves. We can see the infection rate is increasing to be twice as fast in the second week, but we don't know what that rate is. It might be those 100, 150, 200 people are all the people in the State with the virus and the virus infects 100 new people a week in week one. Or it might be that they are 50% of people and the virus infects 200 people a week. Or they may be just 10% of the total number of infected and in the first week, actually, 1000 people were infected but the 1000 tests missed 90% of them.

Accurate antibody tests finally gives us a count so we can find the rate over the past months and we can compare the numbers to the real rate as opposed to the small part we were seeing with the selective viral presence tests.
 
The death rate doesn't tell us anything without a true infection rate.
That's why sampling methods matters and long term sampling we will obtain a fairly reasonable representation of the reality.
The missing number is actual infection rate. All counting to date has been people going to medical services with symptoms to be tested, or medical staff, etc. associated with known cases. Some 10% of them or whatever are positive. Outside of that number is the people not being tested because there's nothing wrong with them. Antibody testing finally let's us catch up with how many people have had C19 and fills in the missing total infection rate.

The changing positivity rate shows increasing or decreasing rate of infection, but not the number of people being infected because we don't have a baseline. Let's say a State performs 1000 tests a day and finds 100 +ves for a week, The next week, they find 150 +ve, and then 200 +ves. We can see the infection rate is increasing to be twice as fast in the second week, but we don't know what that rate is. It might be those 100, 150, 200 people are all the people in the State with the virus and the virus infects 100 new people a week in week one. Or it might be that they are 50% of people and the virus infects 200 people a week. Or they may be just 10% of the total number of infected and in the first week, actually, 1000 people were infected but the 1000 tests missed 90% of them.
Right but with all trends and anomalies, we look at the long term run rate for those samples.

For instance we look at the graphs here, and you look at hospitalization rate. If you zoom in, you'll see that the numbers actually dip up and down quite a bit week to week. It's not until a certain point in time, in which we actually see a trend.
So normally in this case, we would look at this data, and declare a baseline between April to just before June. And that seems fairly consistent. It goes out of band post June.

Interestingly, these are the main challenges we face for most AI models as we move from slow trend prediction, to real-time prediction. As you have a smaller window of data to make a prediction, it's harder to predict properly, this is largely what you are describing. I think looking at the data in this way, we can declare safely that at some point in time a baseline exists between 1700 hospitalizations in Texas +/- 250 for instance and that would be an acceptable evaluation to make of the data. At least given for this 6 month period. Post June there could be a new baseline that things may settle on, that may not return to the 1700 +/- 250. If you look at the top graph, you can see how wildly the sampling for daily new cases swings, but the trend is still there.

EcWszUQXYAQQvmm


Accurate antibody tests finally gives us a count so we can find the rate over the past months and we can compare the numbers to the real rate as opposed to the small part we were seeing with the selective viral presence tests.
This will help over time.

The concern here at this graph should be...
New cases reported ~ 10K
Number of COVID hospitalizations ~9K
That's not good. If the majority of the population is young people, then it throws into question why UK was at 4%, but texas is so much higher. 9.2% in this case.

Which means at 9.2% of active cases becoming hospitalized, they can expect 920 new hospitalizations each day it stays over 10K new daily cases. That's going to be overwhelming very soon. I have serious doubts they will have 920 fresh beds at the go each day.

I think the blue bars on hospitalization are each day.
 
Last edited:
This is nice for an overview but I will continue with my posts for both Dallas County (where I live) and Texas as a whole mainly because Texas has been shown to obscure what is really happening.
Where do you get your numbers from? Can I just source them for my own notebooks, I'll just showcase some interesting metrics since Texas seems worthy of doing some deep diving.
 
Back
Top