
There's really just one..
Missed this one why is Fiji getting similar results to Maxwell 2 then?
There's really just one..
I can only blame myself.Wow, you guys can make simple things complicated, I thought it was obvious from the beginning
My bad, I missed that.ahezard, the newest version of this test is DX12 performance thread
Missed this one why is Fiji getting similar results to Maxwell 2 then?
Shame you didn't flesh out your thoughts.Wow, you guys can make simple things complicated, I thought it was obvious from the beginning
If the compiler is good, it could either skip the vector units completely by emitting pure scalar unit code (saving power) or emitting both scalar + vector in an interleaved "dual issue" way (the CU can issue both at the same cycle, doubling the throughput).Apart from that I can't help wondering if the [numthreads(1, 1, 1)] attribute of the kernel is making AMD do something additionally strange.
I think you have the best AMD results so far for the compute portion of this test.My bad, I missed that.
I do not understand the result of this new test. How can I get similar result to a 290 with my 7790? The pixels pushed/s is lower but execution time is similar.
I think you have the best AMD results so far for the compute portion of this test.
I did have a theory that the single shader engine might make the Cape Verde chip better, but that was based on my belief that the compute should finish much faster. Perhaps there is something there, but it's not blatantly obvious to me right now...
I suspect your card is clocked at more than 1GHz since my 7770 is 1GHz.
The test case is whether graphics processing time can overlay with compute, is there an expectation that a 256 thread group would change the verdict for the GPUs running it?Benchmarking thread groups that are under 256 threads on GCN is not going to lead into any meaningful results, as you would (almost) never use smaller thread groups in real (optimized) applications. I would suspect a performance bug if a kernel thread count doesn't belong to {256, 384, 512}. Single lane thread groups result in less than 1% of meaningful work on GCN. Why would you run code like this on a GPU (instead of using the CPU)? Not a good test case at all. No GPU is optimized for this case.
The current testing does not do this, although a reason to test it would be similar to why people climb mountains: because it's there.Also I question the need to run test cases with tens of (or hundreds of) compute queues. Biggest gains can be had with one or two additional queues (running work that hits different bottlenecks each). More queues will just cause problems (cache trashing, etc).
I believe SALU and VALU ops have to come from different hardware threads, so this specific kernel couldn't be sped up that way.If the compiler is good, it could either skip the vector units completely by emitting pure scalar unit code (saving power) or emitting both scalar + vector in an interleaved "dual issue" way (the CU can issue both at the same cycle, doubling the throughput).
I strongly disagree as I have some code that runs fastest with 64, but I come from an OpenCL perspective (can't get more than 256 work items into a work-group, apart from anything elseBenchmarking thread groups that are under 256 threads on GCN is not going to lead into any meaningful results, as you would (almost) never use smaller thread groups in real (optimized) applications.
 )...
)...Fillrate tests aren't meaningful work either. This test does reveal serial versus async behaviours, so it's a success on those terms.I would suspect a performance bug if a kernel thread count doesn't belong to {256, 384, 512}. Single lane thread groups result in less than 1% of meaningful work on GCN. Why would you run code like this on a GPU (instead of using the CPU)? Not a good test case at all. No GPU is optimized for this case.
The results presented demonstrate async compute, when it's available. The test does so with one or two queues as far as I can tell. It appears that even a single queue, the command list test, results in async compute on GCN. EDIT: erm, actually I don't think that last sentence is correct.Also I question the need to run test cases with tens of (or hundreds of) compute queues. Biggest gains can be had with one or two additional queues (running work that hits different bottlenecks each). More queues will just cause problems (cache trashing, etc).
Well, I am not a native speaker, so it's PITA to flesh out thoughts in the right wayShame you didn't flesh out your thoughts.
Should I explain how the ILP or the lack of ILP due to instructions dependencies affect performance?I've been pondering your comment about dual-issue and I still don't understand how that's relevant
Nope, moreover I've not seen the code, the whole thing was obvious starting from "single lane" words of MDolenc, though instructions dependencies, arithmetic instructions latencies and instructions pairing could affect performance too, but such things really require code analyseDo you know how this code compiles on Maxwell 2?
It's not.
You'll probably resort to a lot of mental gymnastics to claim it is, though.
Good luck with that, I guess. ;-)
http://nubleh.github.io/async/#18
http://nubleh.github.io/async/#38
No mental exercise, looking up the two Fiji tests that might be too much for you, any case can we say Fiji doesn't have hardware supported async because of this test? The results are poor compared to older GCN architecture, although better than nV's hardware, but they mirror the up and down cycles of lower and higher latency at certain points and the step by step increase based on load.
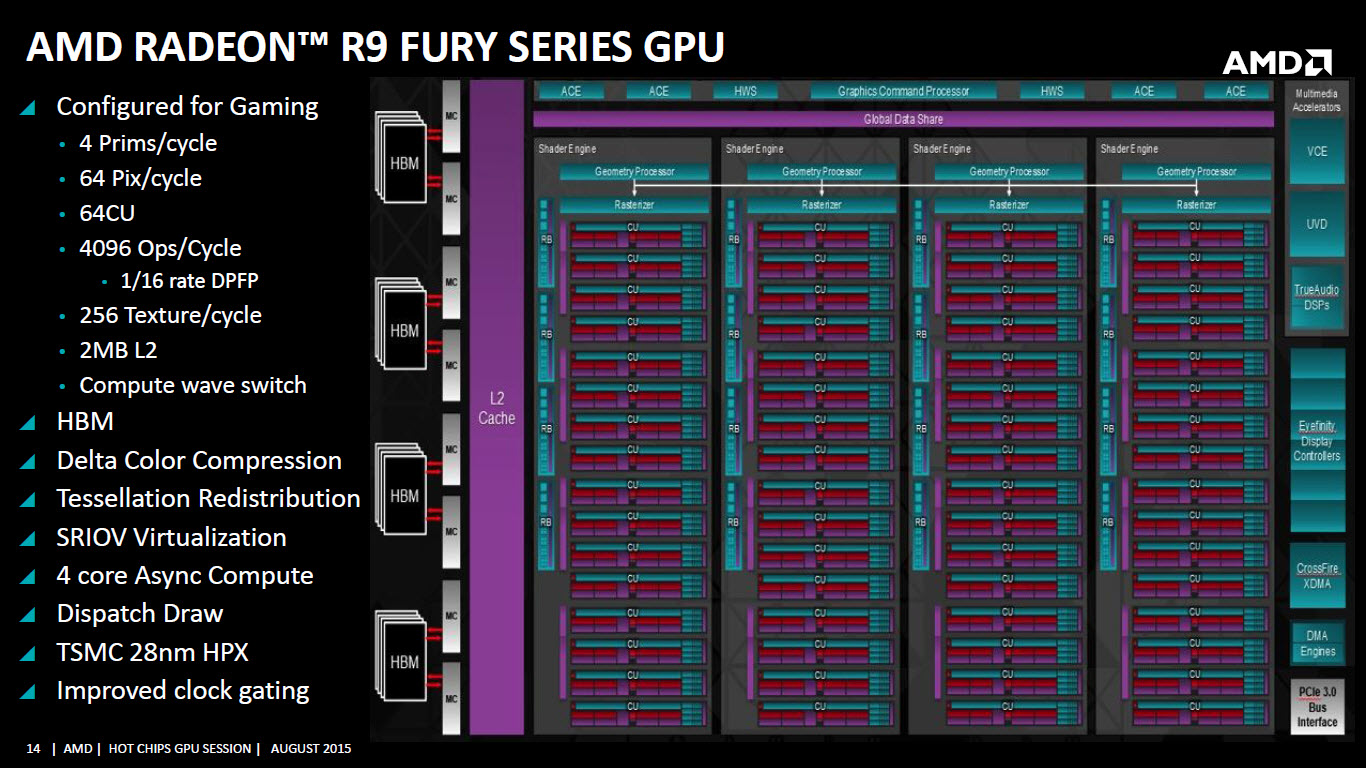
zlatan @ AT said:All newer GCN 1.2 cards have this configuration. There are 4 core ACEs. The two HWS units can do the same work as 4 ACEs, so this is why AMD refer to 8 ACEs in some presentations. The HWS units just smarter and can support more interesting workloads, but AMD don't talk about these right now. I think it has something to do with the HSA QoS feature. Essentially the GCN 1.2 design is not just a efficient multitask system, but also good for multi-user environments.
Most GPUs are not designed to run more than one program, because these systems are not optimized for latency. They can execute multiply GPGPU programs, but executing a game when a GPGPU program is running won't give you good results. This is why HSA has a graphics preemption feature. These GCN 1.2 GPUs can prioritize all graphics task to provide a low-latency output. QoS is just one level further. It can run two games or a game and a GPGPU app simultaneously for two different users, and the performance/experience will be really good with these HWS units.
