GPU Ray-tracing for OpenCL

@Silent_Buddha: yup, the AMD/ATI OpenCL CPU device spawns as many threads as the cores available. At the moment I have the opposite problem, I would like to have some direct control on the number thread spawned in order to not overload the CPU (and slow down threads dedicated to drive the GPUs).

I was just wondering about that myself. That was my next question for you. Whether there was a way to limit the number of threads/number of cores used on a CPU. As I'd imagine it could be problematic in say a game for instance, if the core game required 1-2 cores for good performance, but would then like anything using OpenCL to be able to fully occupy all remaining cores.

Regards,
SB
 
Can't you just increase the priority on the GPU rendering threads?

PS. does calling clfinish at near 200 Hz (on the faster ATI cards) really have no impact on performance? (If I had a graphics card which could run it I'd try doing clfinish once every 20 invocations or so instead, but I don't.)
 
Last edited by a moderator:
@Talonman: you could try the version 2.0 with your 3xGPUs setup. I uploaded a preliminary version at http://davibu.interfree.it/opencl/smallptgpu2/smallptgpu-v2.0alpha1.tgz

This version should run on all GPUs (and CPUs on Apple/ATI) available. It is highly untested and I'm experiencing a problem under Windows: my PC resets after few seconds like if my power supply couldn't sustain the load :oops: Everything works fine under Linux ... quite strange. Well, it may crash but you can give it a try.

Thinks! Preliminary report is in...

She works... she works!! :smile:

This was with running the 'smallptGPU' executable.
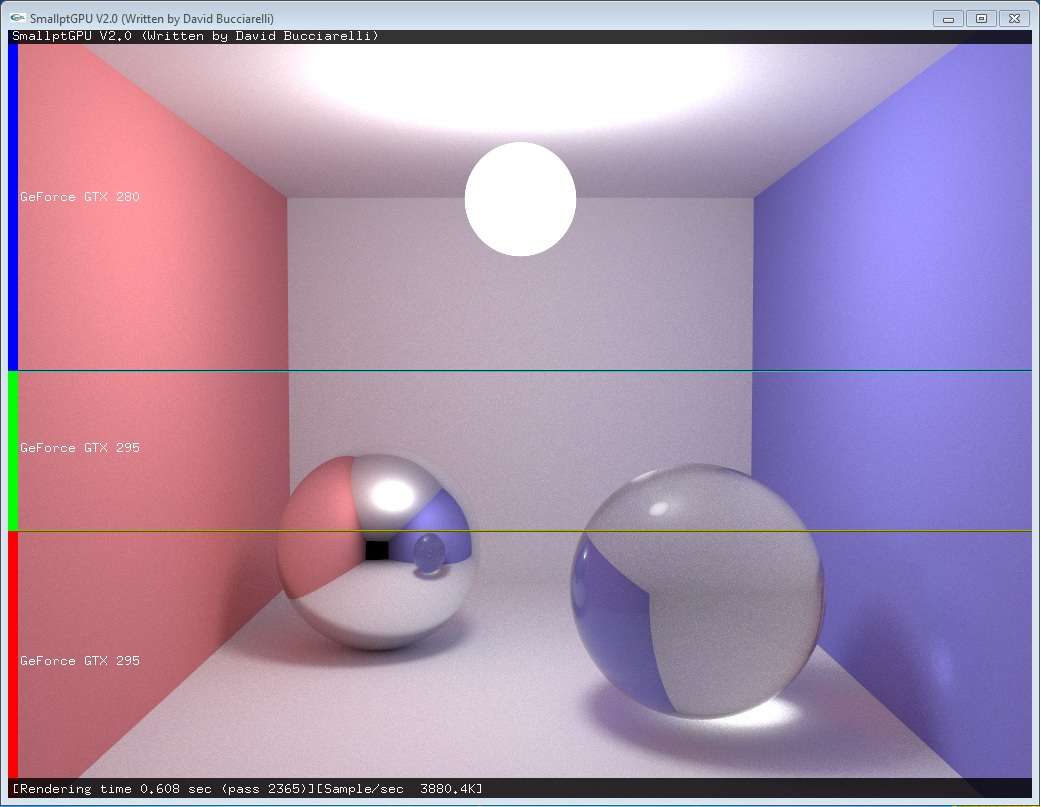
Now getting 3,880K Samples/sec:
v2alpha.jpg


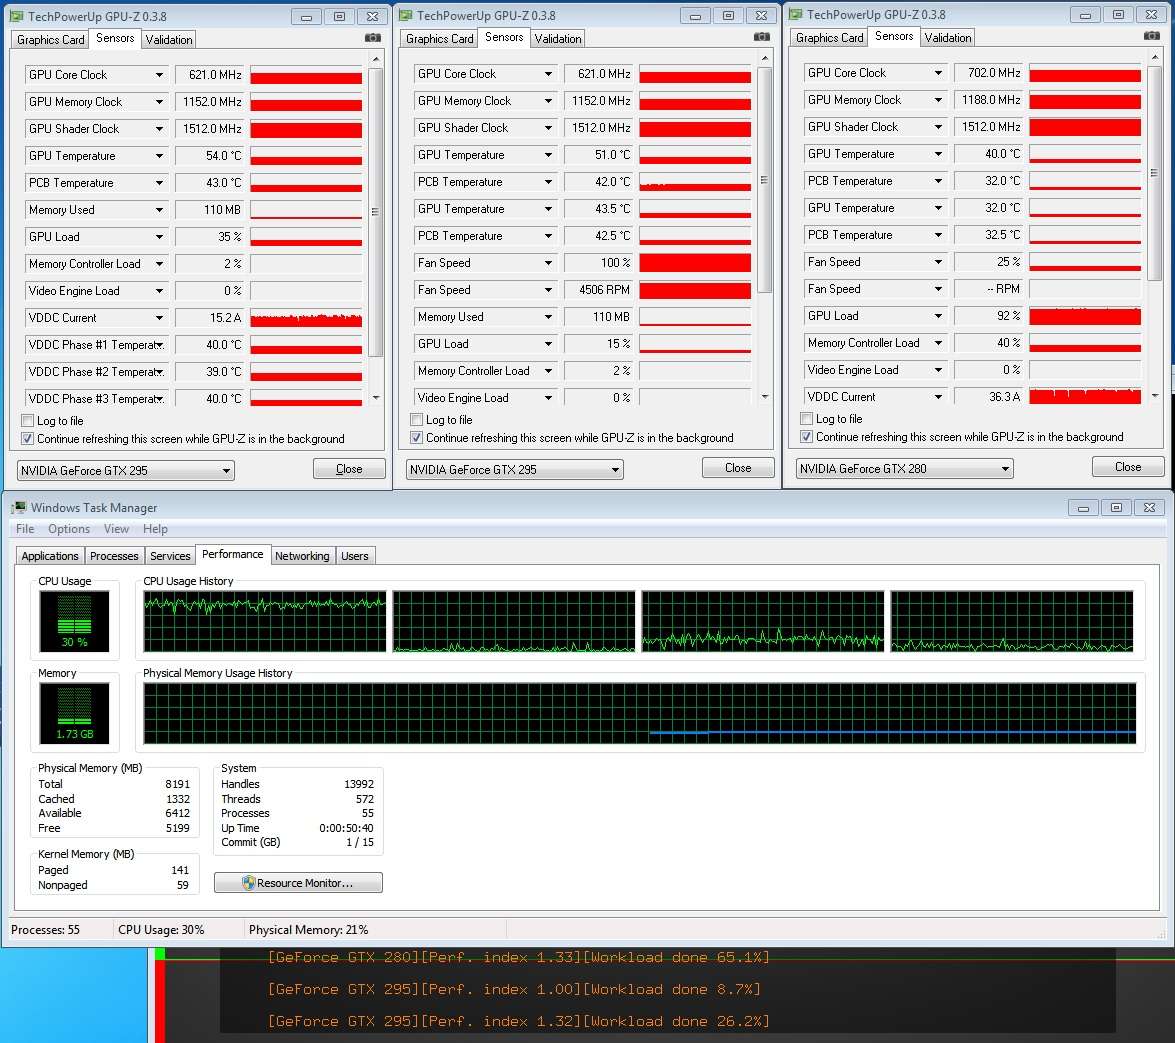
GPU-z reporting workload distribution@
First 1/2 of my 295 - 73%
Second 1/2 of my 295 - 50%
280 Dedicated PhysX - 98%
Q6600 - 29%
v2alpha2.jpg


Looking good too...
v2alpha3.jpg


I will report back with my using the various 'Size' bat files.

UPDATE:
smallptGPU - 3,880
RUN_SCENE_CORNELL_32SIZE - 2,401
RUN_SCENE_CORNELL_64SIZE - 3,880
RUN_SCENE_CORNELL_128SIZE - 3,516
RUN_SCENE_SIMPLE_64SIZE - 77,879.7
v2alpha4.jpg


Last edited by a moderator:
Running the Simple, workload distribution reported by GPU-z was:
First 1/2 of my 295 - 35%
Second 1/2 of my 295 - 15%
280 Dedicated PhysX - 92%
Q6600 - 30%
v2alpha5.jpg


FYI - No system reset problems of any kind. She is solid as a rock so far.

You may also be interested in knowing that the S
mallptGPU, and the Simple Scene run fine against each other...
GPU-z reporting workload distribution@
First 1/2 of my 295 - 71%
Second 1/2 of my 295 - 41%
280 Dedicated PhysX - 96%
Q6600 - 63%
Getting 3602.0K Samples/sec on both instances.
v2alpha6.jpg

I was playing with the '1' key, that is the reason you see the 'Updating OpenCL Device workloads' so many times.
 
Last edited by a moderator:
Wow, Talonman, thank you, I love the pictures with the 3 GPUs at work.

Good if it is stable .. now I'm a bit worried of the status of my power supply ;) or my be it is just a bug in the ATI Windows XP driver because everything works fine under Linux.
 
Wow, Talonman, thank you, I love the pictures with the 3 GPUs at work.

Good if it is stable .. now I'm a bit worried of the status of my power supply ;) or my be it is just a bug in the ATI Windows XP driver because everything works fine under Linux.
Thanks...

Look here for more BETA testers on the new version. (ATI users too)

http://www.xtremesystems.org/forums/showthread.php?t=241904&page=3

I think the GPU workload balancing could use a bit of an adjustment, but love the progress your making.

Keep up the fine job. ;)
 
Last edited by a moderator:
I made a binary of the 2.0alpha on OSX, needed just a few CFLAGS really (-I/opt/local/include -L/opt/local/lib -lboost_thread-mt, this is for boost 1.41 from macports which is probably most widely used). And a minor typo on line 34 of displayfunc.cpp __APPLE_ needs extra underscore. So nothing big, works sweet.

Looking at utilisation I reckon it's still leaving cycles on the table for now but great new development Dade :)

Here's a shot of one of the few boxes where the CPU does a sizeable part of the work:

selene20.jpg
 
Try the "cl-mad-enable" or "cl-fast-relaxed-math" compiler options. Or, even, "-cl-unsafe-math-optimizations".

Jawed

unsafe didn't seem to make a difference, and the current release is actually slightly faster (~16K s/sec) w/o the other 2 options on OS X.. curiously
 
Dade - can load balancing between GPU and CPU be manually adjusted after application do it's automatic balance? The problem I can see is when someone like me likes to change GPU and CPU freq. on the fly, the app will not work optimally.
Also for some reason it's not balancing ideally for clocks above 850MHz on my GPU (the CPU/GPU ratio stays roughly the same when it should be giving more work for GPU). With manual adjustement I can give for example 96% for GPU and only 4% for CPU which probably give me best performance in 1GHz GPU - 3.5GHz QC CPU confing.

Hope this can be implemented!

:D
 
Hyperthreading with ATI Stream SDK :LOL:

heracpustream.jpg


The i7 is almost exactly as fast as the GTX280 (ie proof positive that Nvidia's current OpenCL.dll is sh*t)
 
Copy one of the batch files to make a new one called complex.bat and make it like so:

smallptGPU.exe 1 1 64 640 480 scenes\complex.scn

This is a new scene file. The number of spheres is quite meaty...

Jawed
 
Dade - can load balancing between GPU and CPU be manually adjusted after application do it's automatic balance? The problem I can see is when someone like me likes to change GPU and CPU freq. on the fly, the app will not work optimally.
Also for some reason it's not balancing ideally for clocks above 850MHz on my GPU (the CPU/GPU ratio stays roughly the same when it should be giving more work for GPU). With manual adjustement I can give for example 96% for GPU and only 4% for CPU which probably give me best performance in 1GHz GPU - 3.5GHz QC CPU confing.

Hope this can be implemented!

It is just a matter of adding few keybindings to hand tune the % of workload assigned to each device, I'm going to add this feature ;)

You my have notice that at the moment the workload % is decided after 10secs of "Profiling" with the work evenly split among all devices. I guess it is a too short period but increasing the profiling time would be just annoying so hand tuning is probably the best solution.
 
Copy one of the batch files to make a new one called complex.bat and make it like so:

smallptGPU.exe 1 1 64 640 480 scenes\complex.scn

This is a new scene file. The number of spheres is quite meaty...

Jawed, that scene is quite "terrible" given the current brute force intersection algorithm used in smallptGPU.

My first idea was to keep smallptGPU very simple but I guess it is worth adding a simple BVH to accelerate ray intersections so we can play with thousands of spheres instead that just 5 or 6 ;)
 
For trivia, w1zzard, the programmer of GPU-z is at Xtreme Systems, was asked what he was using to read the % of workload on each GPU. He posted "I'm using the official interface provided by nvidia in their nvapi."

I don't know if you could also use it or not... :)

It would be fun to see the actual workload % change on the screen, as we hit the keys.


http://www.evga.com/forums/tm.aspx?m=91863&mpage=3
Posted by Spongebob28:
"I want to join in on the games.

V2.0 Alpha

Geforce 8800 GT Perf. index 1.00 Workload done 34.2%
Geforce GTX 295 Perf. index 2.28 Workload done 21.8%
Geforce GTX 295 Perf. index 2.28 Workload done 44.0%

Rending time 0.625 sec pass 447 Sample/sec 1820.8K."
 
Last edited by a moderator:
I'm curious what the differences are between David's program and this one??

http://code.google.com/p/tokaspt/

He is claiming 185.6M 4 bounce rays per second. I would need about 13 HD5850's to get close to that with SmallptGPU:oops:

Samples are not Rays. SmallptGPU traces 12 rays (2 for each path vertex, 6 path depth max.) to generate a sample. It means running at 228M rays/sec in case of the 19000M samples/sec of a 5870.

You could look at the "spp" (i.e.Sample Per Sec) statistic there to try to do a direct comparison.
 
I'm a 100% noob and was not sure if he was using some sort of fancy code to speed things up. Thanks for the clarification!!
 
Outstanding job again Dave!!

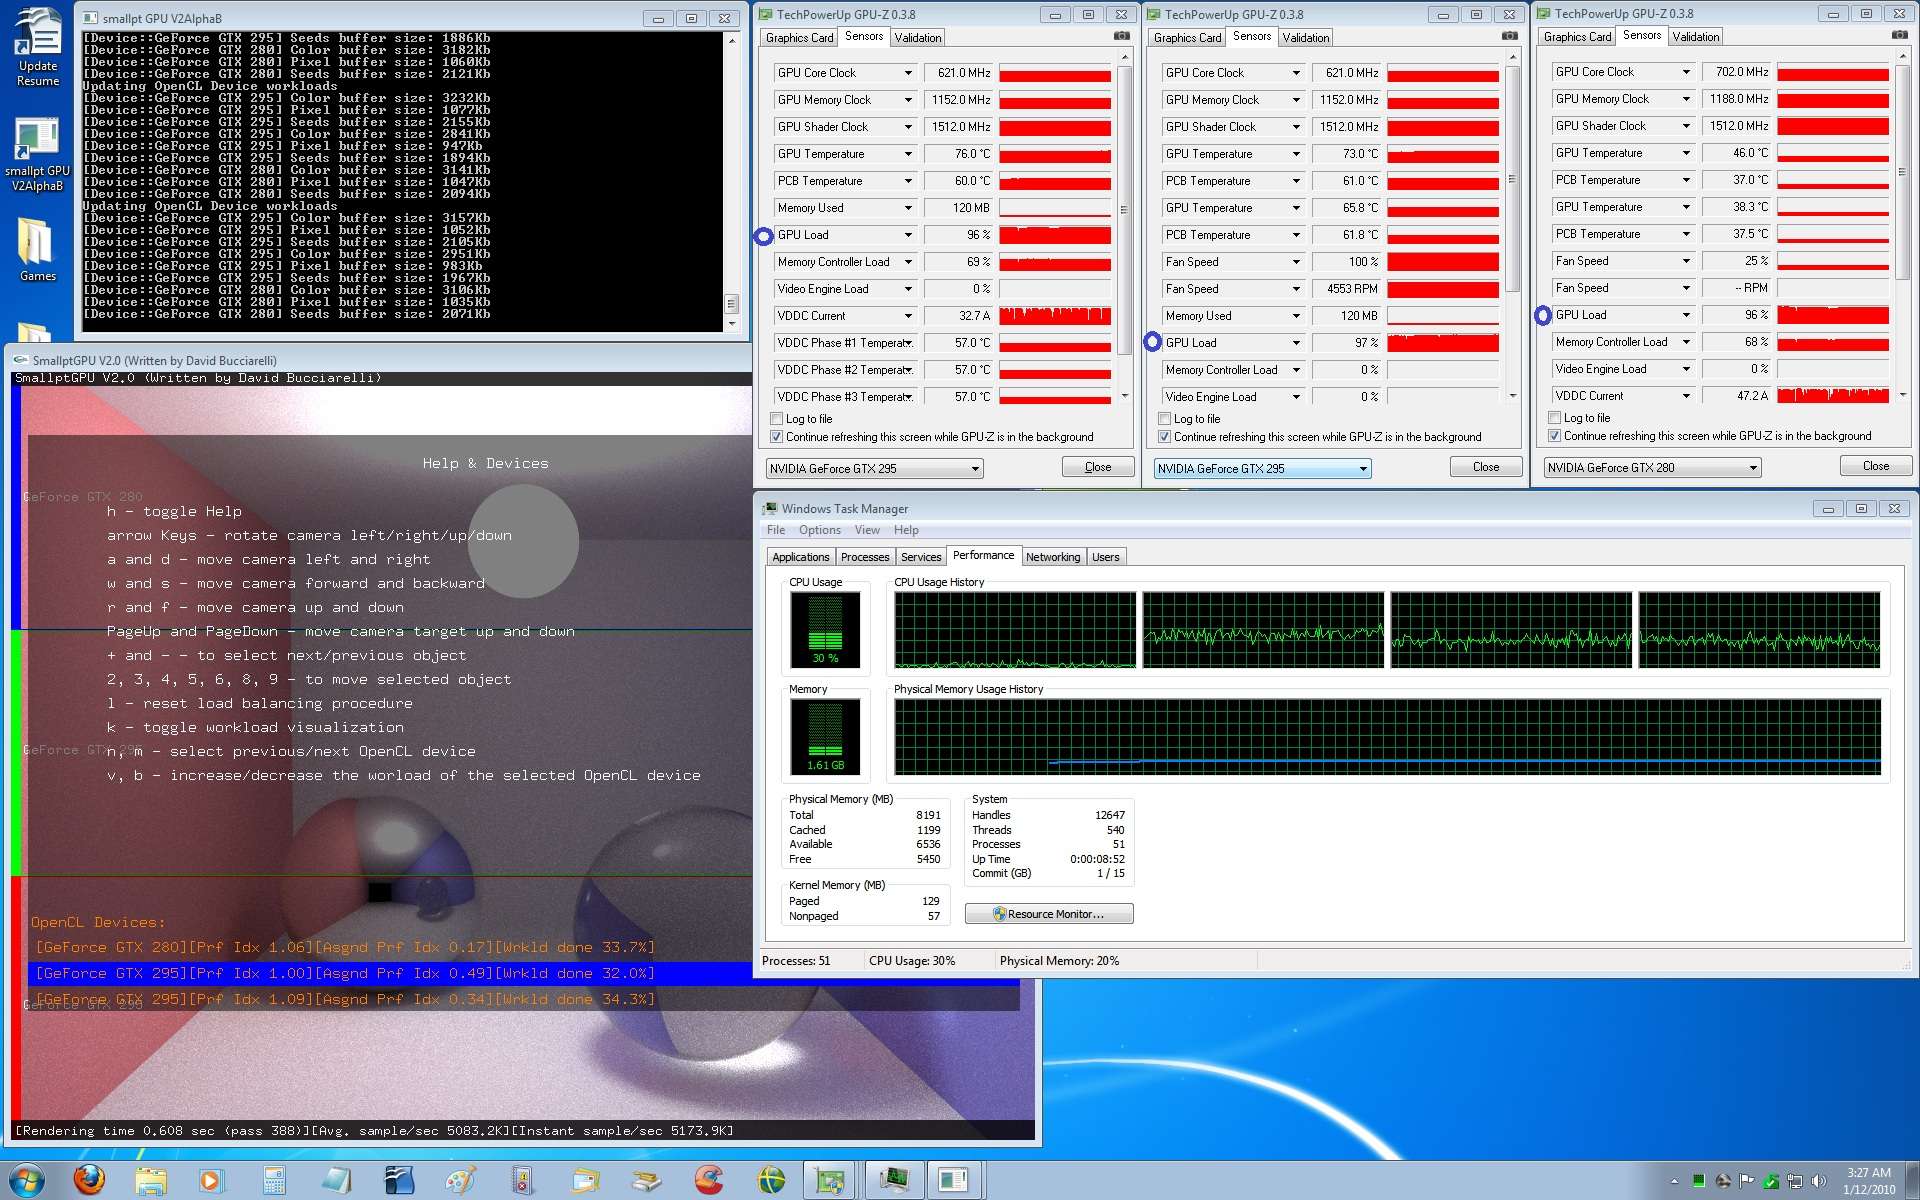
By manually adjusting the workload, I now can get 5173.9K Samples/sec. (A new record on my system.)
First 1/2 of my 295 - 96%
Second 1/2 of my 295 - 97%
280 Dedicated PhysX - 96%
Q6600 - 30% (Exactly the same as the first 2.0Alpha, without the manual GPU workload distribution feature.)

Apparently balancing the GPU's workload does NOT change the CPU's utilization at all...
v2alphab1.jpg


Note that I now feel there is no need for GPU-z anymore, I simply need to get all 3 GPU's to read as close to 33.3% as I can, using your program.
The displayed workload distribution % in your program is accurate. :)

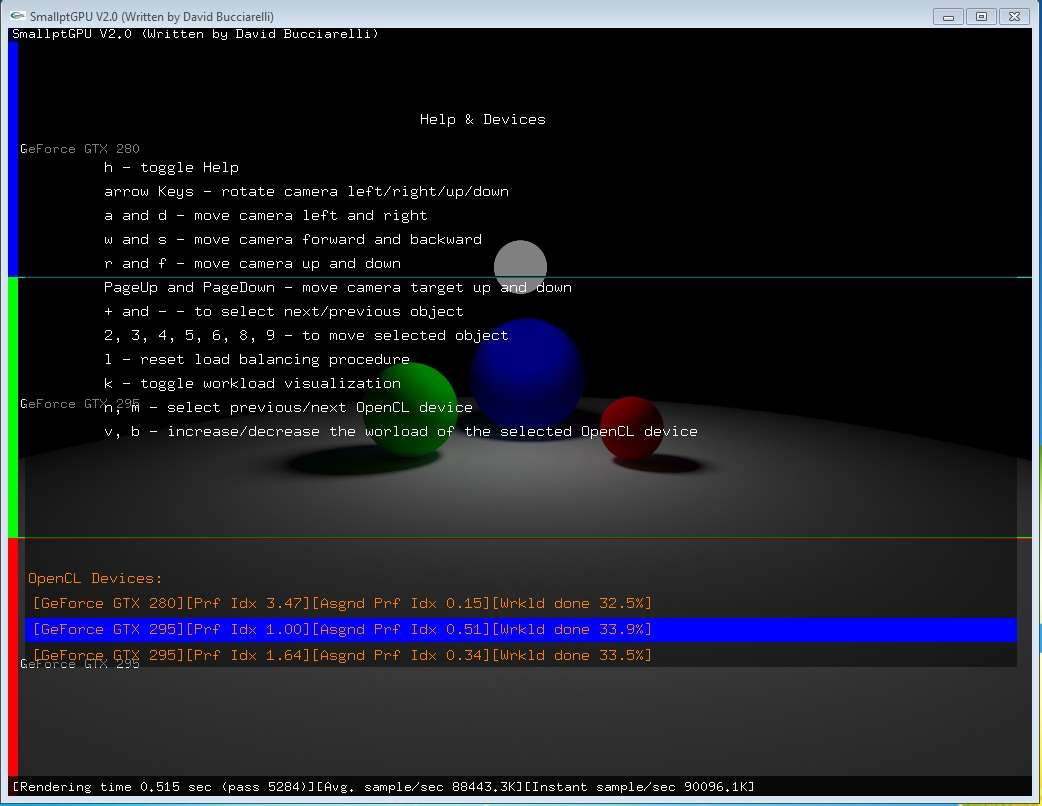
The Simple Scene also has the manual adjustment feature, and it also is working well:
simple2alphab.jpg
 
Last edited by a moderator:
Back
Top